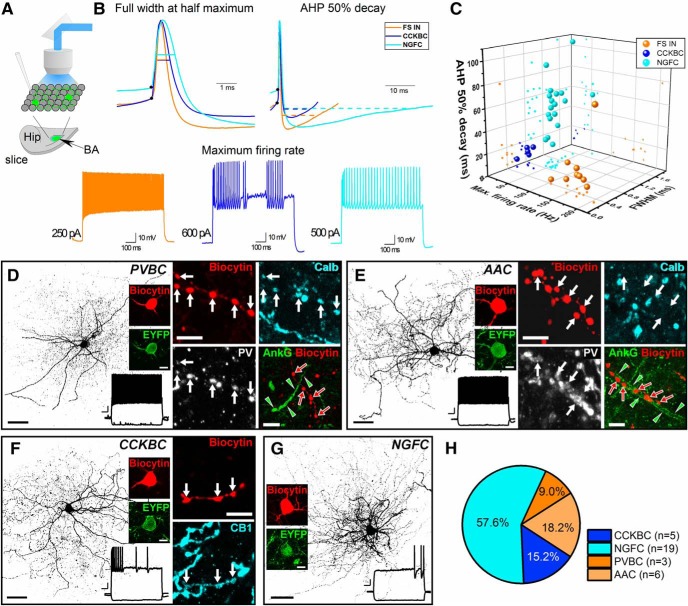
Figure 4.
Action potential features distinguish GABAergic cell types labeled with intersectional viral strategy. A, Schematic drawing depicts a horizontal slice with viral expression shown in green (Hip = hippocampus). Whole-cell patch clamp recordings were performed in INTRSECT-ChR2-transfected GABAergic cells (green circles) visualized by blue light illumination. B, Traces exemplifying differences in the full width at action potential half maximum (FWHM), 50% decay of AHP and maximum firing rate for the three electrophysiologically distinct IN groups: fast-spiking INs (FS INs) in orange, CCK+ basket cells (CCKBCs) in blue, and NGFCs in cyan. C, 3D plot showing the separation of 33 intracellularly labeled EYFP+ INs based on the three action potential parameters. D–G, Examples of four distinct types of EYFP-expressing INs intracellularly filled by whole-cell recording in vitro. In each case, a maximal intensity projection of a 3D confocal image of the labeled INs is shown together with its firing pattern and the EYFP expression at the soma level. D, An example for a PV+ basket cell (PVBC) identified based on its firing pattern, Calb and PV positivity in its axonal boutons (white arrows in insets) and forming no close appositions (red arrows) with ankyrin G (AnkG)-labeled axon initial segments (delimited by green arrowheads). E, An example for a PV+ axo-axonic cell (AAC) identified based on its firing pattern, PV positivity and Calb negativity in its axonal boutons (white arrows in insets) and forming close appositions by its axonal boutons (red arrows) with an AnkG-labeled axon initial segment (delimited by green arrowheads). F, An example for a CCKBC identified based on its firing pattern and on the CB1 content in its axonal boutons (white arrows in insets). G, An example of a NGFC based on its dendritic and axonal morphology and characteristic firing pattern. H, Pie chart showing the ratio of identified IN types in a group of EYFP-expressing neurons in the BA that were randomly sampled in slice preparations. For D–G depictions of maximal intensity projections of intracellularly filled cells, scale bar = 40 µm, insets = 5 µm; firing pattern scale bar x-axis = 100 ms, y-axis = 10 mV.

