Figure 3.
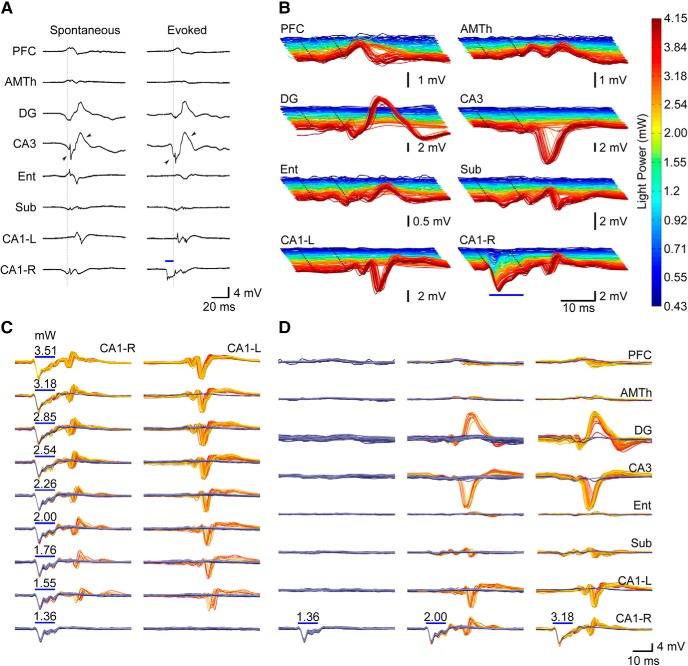
Optogenetic stimulation produces network wide PDs that closely resemble spontaneous IIS with a probability that increases with light intensity. A, Example comparing spontaneous IIS to oPDs. Spontaneous IIS are characterized by near synchronous activation in DG, CA3, and CA1-R, and delayed activation in CA1-L. Evoked discharges are led by activation in CA1 (stimulation site) followed by near synchronous activation of DG, CA3, and CA1 with a latency of ∼10 ms. Note similar timing and wave shape between stimulus evoked and spontaneous discharges (arrowheads). Blue bars indicate onset and duration of light stimulus in CA1. ISI = 3 s. B, Evoked network activity produced by optogenetic stimulation of area CA1 (right side) at varying light intensities in a representative animal (different from that depicted in A). Note large amplitude oPDs evoked at higher intensities. Dotted lines indicate the beginning and end of the light pulse. C, D, Probability of oPD occurrence in downstream sites, rather than amplitude, increases with light intensity at the stimulation site. In area CA1-L, a longer latency response is accompanied by a high amplitude PD. The gold colored traces are those in which a PD was detected, the blue are traces where it was absent. Each plot is an overlay of 60 trials, and the color gradient indicates chronological order (dark blue/red for early trials, light blue/yellow for late trials). oPD occurrences: 0/60 at 1.36 mW, 11/60 at 2 mW, 58/60 at 3.18 mW. ISI = 3 s. Scale bars in D also apply to C.

