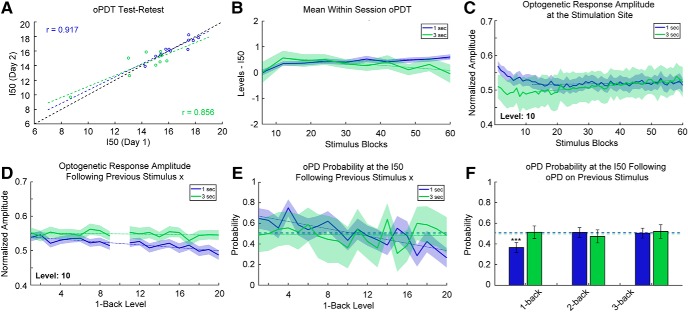
Figure 6.
Stability and reliability of the oPDT. A, Test-retest comparison of session I50s on consecutive days; n = 11 pairs for 1-s interval and n = 9 pairs for 3-s interval. Each session I50 is calculated from 60 replicates. Dashed black line indicates the diagonal. B, I50 is relatively stable over the course of a session. Mean normalized intermediate I50s (six replicate bins) for 1- and 3-s ISIs. Each stimulus block consisted of 20 intensity levels presented in random order. Order was randomized independently for each block. Session duration is 20 min for the 1-s ISI and 60 min for the 3-s ISI; n = 67 and n = 41 sessions for the 1- and 3-s ISIs, respectively. Shaded bars indicate 95% CI. Dotted lines indicate best fit (linear regression) excluding blocks 1–12. C, Optogenetic response amplitude is reduced within the first 5 min of recording, likely due to ChR2 desensitization. Values were transformed via min-max normalization for the entire curve. Same dataset as in B. Dotted lines indicate best fit (linear regression) excluding blocks 1–12. D, The optogenetic response amplitude at the stimulation site is reduced following high intensity stimuli (1-back stimuli are plotted on the x-axis). The y-axis indicates the mean normalized response amplitude at level 10. Same dataset as in B. E, The probability of an oPD at the I50 depends on the intensity of the previous stimulus for 1-s intervals. Dashed lines indicate the overall probability of an oPD at a level within ±0.25 of the I50. Dotted lines indicate best fit (linear regression); 1 s: n = 29 sessions, 1740 trials, 3 s: n = 10 sessions, 600 trials. F, oPDs that occur <2 s prior have a suppressive effect on the probability of an oPD at the I50. Dashed lines indicate the overall probability of an oPD at a level within ±0.25 of the I50. Error bars indicate the 95% CI. Same subset as in E.

