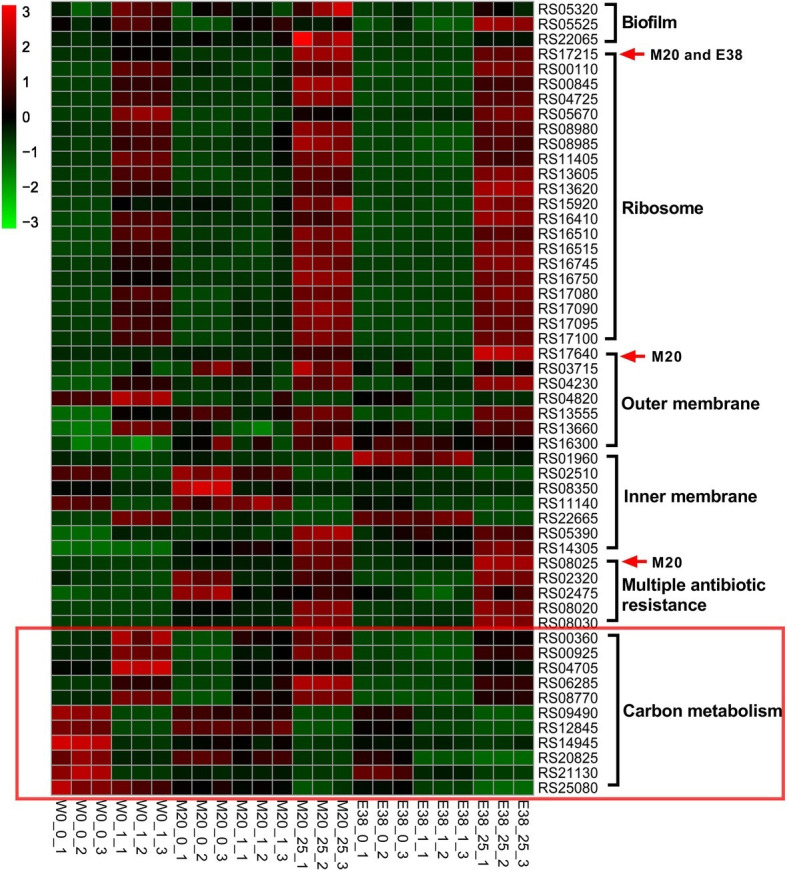
Figure 2.

Transcriptomic and genomic information for genes involved in DOX resistance. The greener the square on the heat map is, the lower the expression level of the gene, and the redder the square is, the higher the expression level of the gene. The mutated genes in strain M20 or E38 are indicated by red arrows. The ordinate represents the gene ID. The abscissa indicates the grouping, wherein the second numbers, i.e., 0, 1, and 25, indicate the concentration of DOX (0, 1, and 25 μg/ml, respectively), and the third number indicates the number of repetitions.
