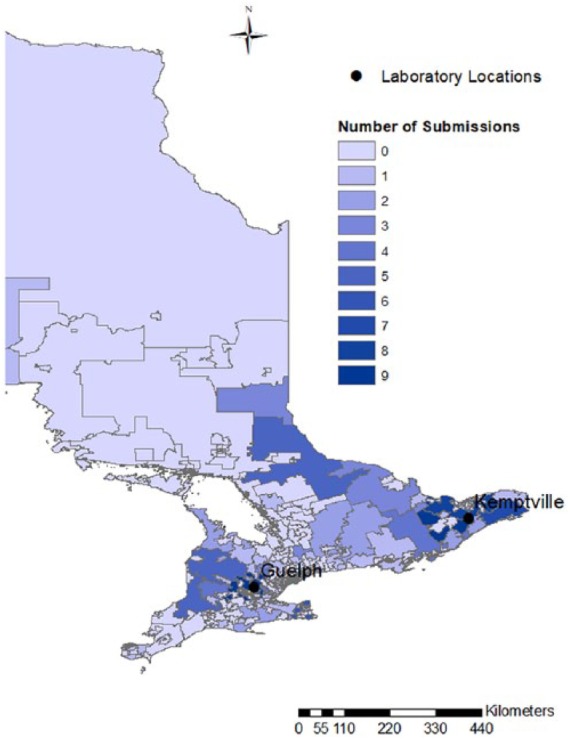
Figure 1.

Choropleth map of Ontario, Canada, subdivided by forward sortation areas (first 3 characters of the postal code). The number of submissions from each area is represented using a heat map, with lighter colors denoting low numbers and darker colors denoting high numbers. The locations of the 2 Animal Health Laboratories are identified.
