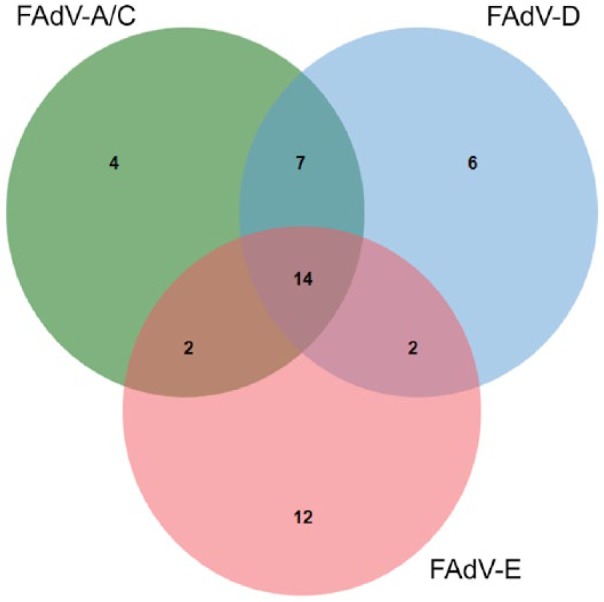
Figure 3.

Venn diagram illustrating relations among genotypes in fowl adenovirus (FAdV)-positive chicken submissions in a small poultry flock surveillance study in Ontario. The presence of FAdV was detected using reverse-transcription, real-time PCR on pooled cloacal swabs. Genotypes A/C, D, and E were differentiated based on multiplex assays designed to detect the FAdV genotypes found most commonly in Canadian chickens.13,28
