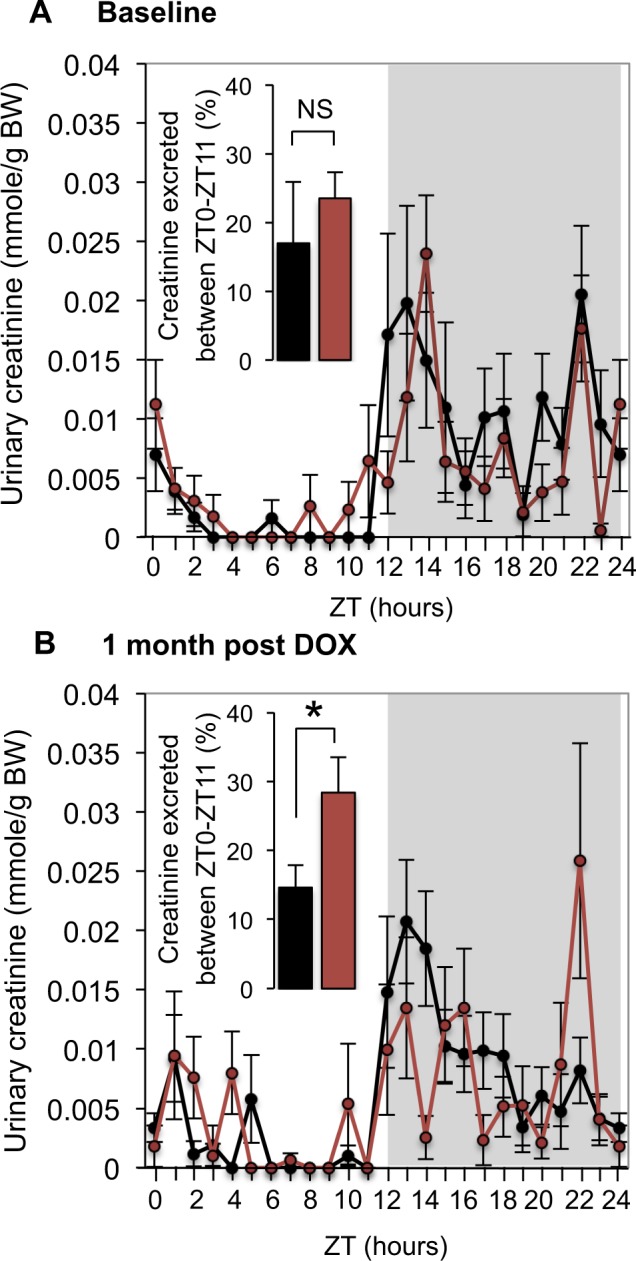
Figure 4.

Urinary creatinine excretion during the inactive (light) phase (ZT0-ZT11) is higher in cKO mice. Profiles of every-hour urinary creatinine excretion in Control (black) and cKO (red) mice in (A) baseline (before DOX treatment) and (B) one month after the end of the DOX treatment. Bar plots represent the percentage of 24-hour urinary creatinine excretion excreted during the inactive (light) phase (ZT0-ZT11). *p < 0.05 (unpaired t test). n = 10 for cKO mice after DOX treatment, n = 11 in all other groups.
