Figure 2.
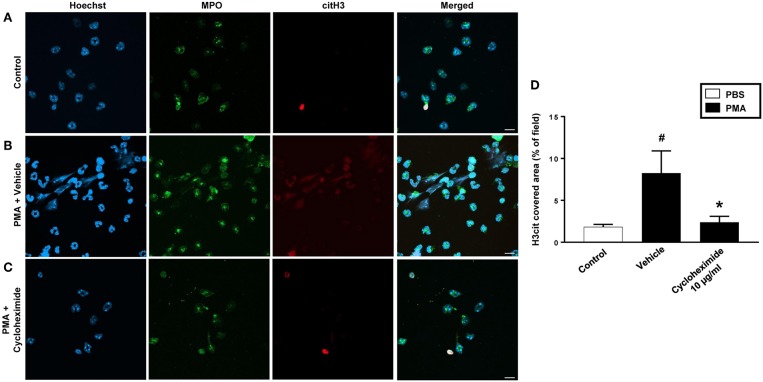
NETs were visualized by confocal immunofluorescence microscopy in isolated neutrophils. Cells were preincubated with or without 10 μg/ml cycloheximide and stimulated with PMA (500 nM) for 3 h at 37°C. (A–C) Neutrophils were immune-stained with antibodies to myeloperoxidase (MPO-green), citrullinated Histone H3 (citH3-red), hoechst-blue to counterstain DNA. Non-stimulated cells served as a control. Images are representative of four independent experiments. Scale bars = 10 μm. (D) NETs covered area per field of view were quantified using Fiji and expressed as percentage of H3cit covered area. Data represent mean ± SEM and n = 4. #P < 0.05 vs. control and *P < 0.05 vs. Vehicle.

