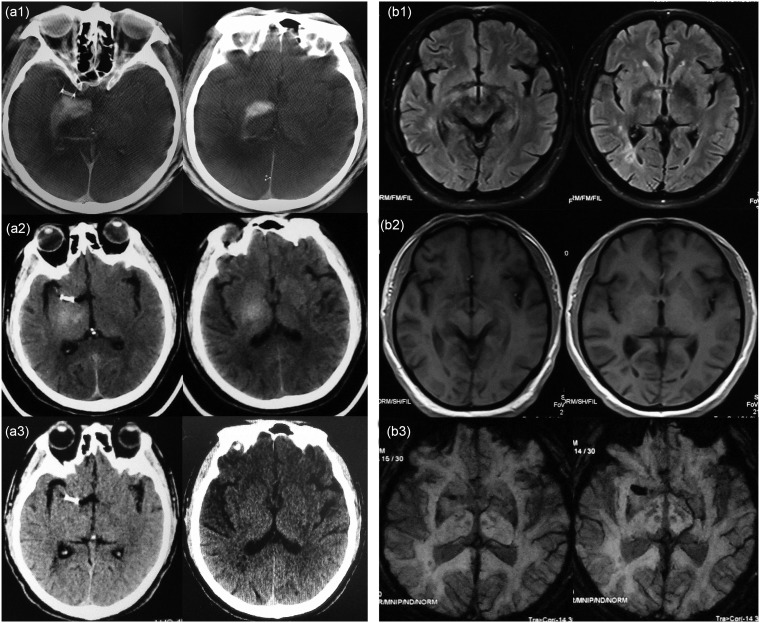
Figure 2.
(a1) A post-procedure plain Dyna computed tomography (CT) scan showed a hyperdensity (50∼78 HU) in the right basal ganglia, ipsilateral to the angioplasty and stenting of the middle cerebral artery. (a2) Twenty-four-hour CT follow-up showed that the hyperdensity became lighter compared to that in (a1). (a3) Three-day CT follow-up showed a compete resolution of all findings in (a1). (b). Two-day magnetic resonance imaging follow-up: (b1) T2 fluid-attenuated inversion recovery showed a slightly increased signal in the right basal ganglia. (b2) T1-weighted imaging showed equisignal and a slightly hyper-signal. (b3) Susceptibility-weighted imaging showed no low-signal in the right basal ganglia region.

