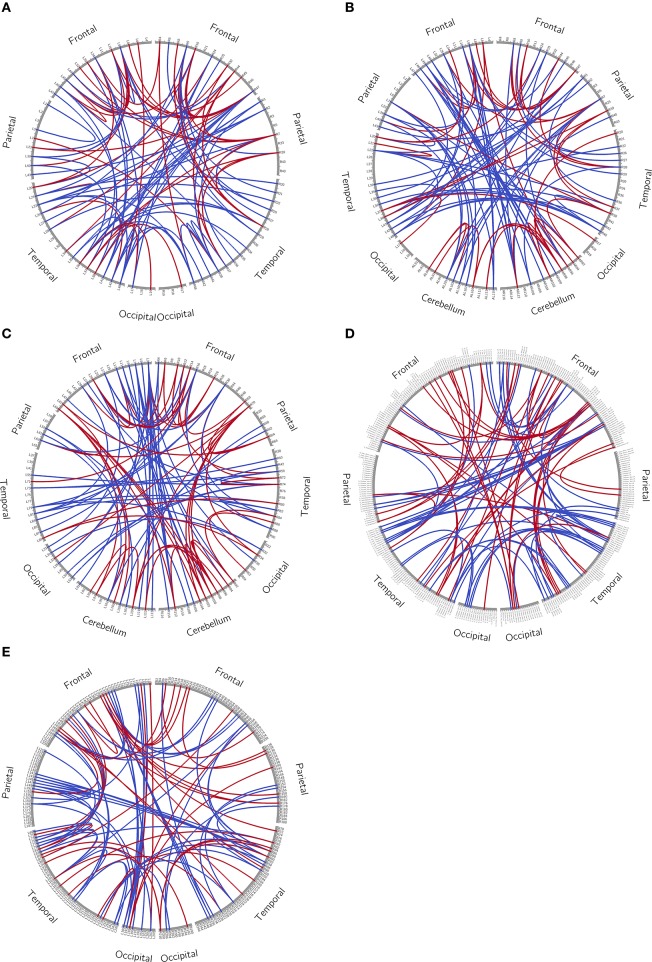
Figure A1.
Circos plot. The whole brain was separated into frontal, parietal, temporal and occipital lobe, with or without cerebellum. Each brain region was arranged so that frontal regions appeared on the top of the graph. Only the most different 100 connections between the healthy control group and patient group (connections with highest absolute t-values during t-test) were shown. (A) Brodmann atlas; (B) Brodmann_ce atlas; (C) AAL atlas; (D) AICHA atlas; (E) Brainnetome atlas.

