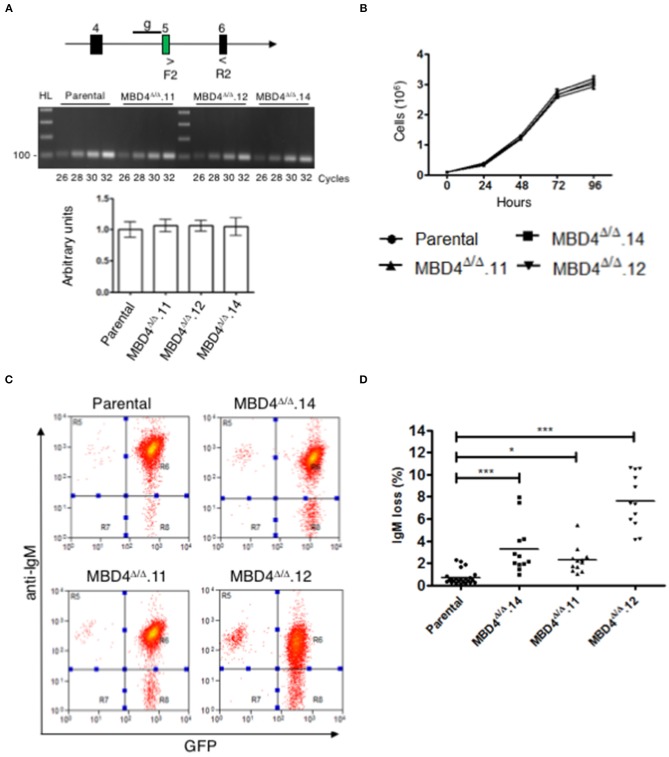
Figure 3.
SHM is elevated in DT40 derived MBD4Δ/Δ clones. (A) Schematic of exons 4, 5, and 6 in the Mbd4 gene and primers F2 and R2 used for RT-PCR analysis. gRNA sequence is indicated by a line (g) in early exon 5 (upper panel). Semi-quantitative RT-PCR analysis of Mbd4 exons 5–6 in parental and deleted clones (middle panel). QRT-PCR analysis of 18S RNA was used as a loading control (lower panel). 18S sample values were normalized to parental values which were set to 1. Samples were assayed in triplicate and were averaged, and SEMs are shown. (B) Cell proliferation assays. Cells (1 × 10⁵/ml) were grown in culture for 96 h and live cells were counted in triplicate every 24 h. The data shown is the average and is representative of 3 independent samples. (C) IgM fluorescence loss is analyzed in parental and MBD4Δ/Δ.14, MBD4Δ/Δ.11, and MBD4Δ/Δ.12 deletion clones by flow cytometry. Cells were FACS sorted at day 0 for IgM+GFP+ cells and re-analyzed after 28 days in culture. Flow cytometry analyses are representative of 24 parental- and 12 subclones from each of the MBD4Δ/Δ deletion clones. (D) IgM fluorescence loss was quantitated for each parental and MBD4Δ/Δ deletion subclone after 28 days in culture. Each data point is representative of a single sub-clone. Bars indicate the median in each data set. P-value *p < 0.05 and ***p < 0.0005 was analyzed using Kruskal-Wallis test.

