
Figure 3.
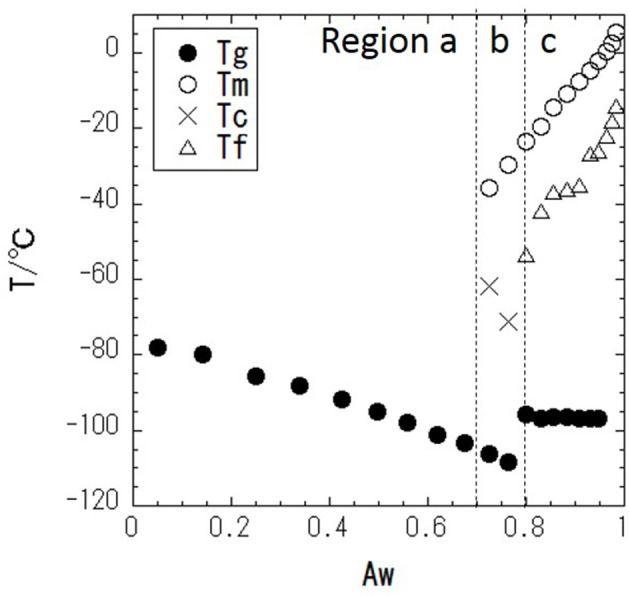
Phase diagram of glycerol–water mixture with temperature (T/°C) vs. water activity (Aw); • is the glass transition temperature, Tg, ○ is the melting temperature, Tm, × is the cold-crystallization temperature, Tc, and Δ is the freezing temperature, Tf.