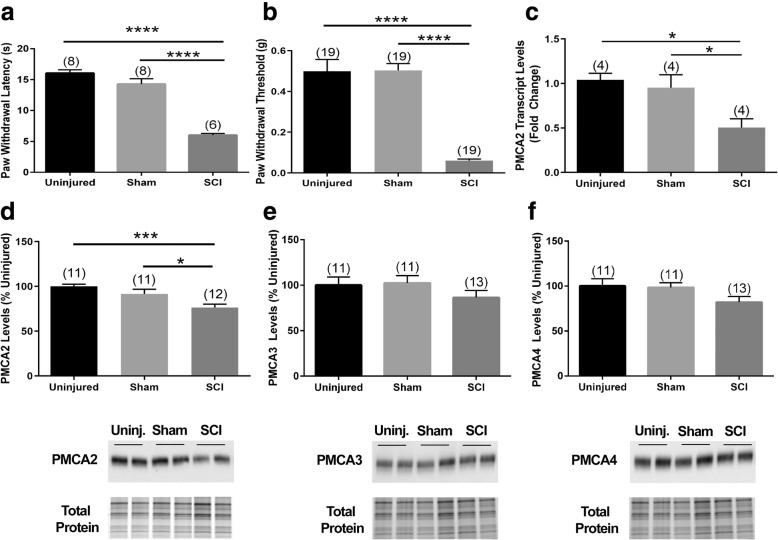
Fig. 8.
PMCA2 levels in the lumbar DH of mice sustaining a SCI and manifesting chronic pain. Assessment of the a Hargreaves test and b von Frey filament test in mice sustaining a SCI at 28 dpi. c PMCA2 transcript levels in the lumbar DH of mice at 28 dpi. d PMCA2, e PMAC3, and f PMCA4 protein levels in the lumbar DH of mice at 28 dpi. Graphs (upper panels) show the quantification of the band intensity in the Western blots (lower panels; two representative lanes per group). Total protein was used to normalize for experimental variations. The number of mice in each group is shown above bars. Values represent mean ± SEM. Significantly different by one-way ANOVA and Tukey’s post hoc test. *p < 0.05, ***p < 0.001, and ****p < 0.0001

