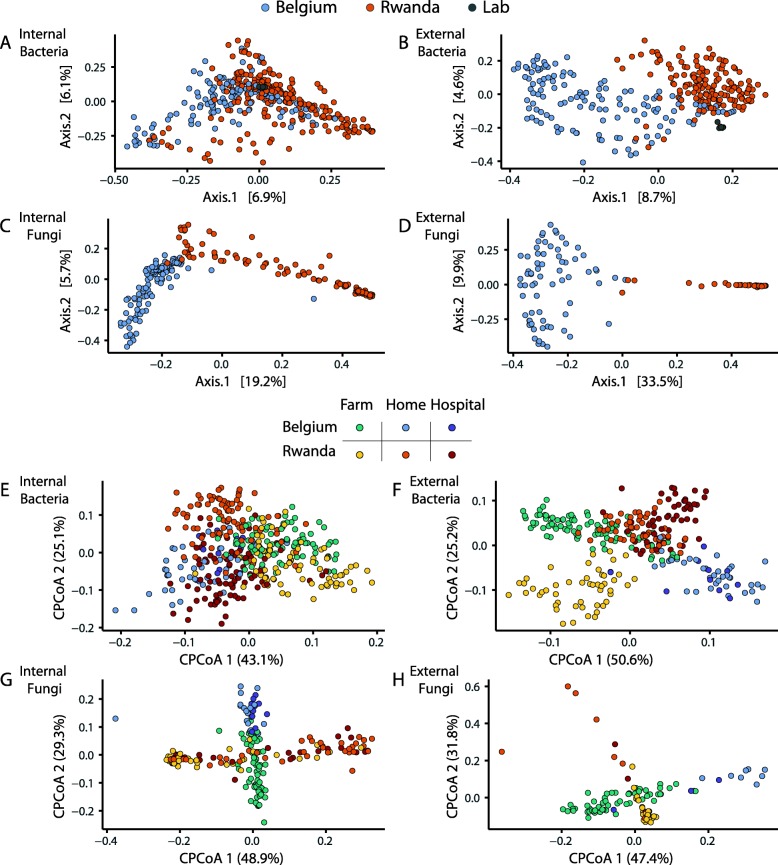
Fig. 2.
PCoA analysis demonstrating the influence of geography and habitat on bacterial and fungal communities. a–d Principle coordinates analysis of Bray-Curtis distances of a internal bacteria, b external bacteria, c internal fungi, and d external fungi. Axes represent the two components of variation explaining the greatest proportion of variation in the data set. The third axis for each graph is 4.7%, 3.5%, 5.0%, and 8.0%, respectively. e–h Constrained analysis of principle coordinates on Bray-Curtis distances of e internal bacteria, f external bacteria, g internal fungi, and h external fungi. The variance explained is 4.37%, 6.86%, 4,18% and 6,00%, respectively, with p value of 0.001. The third axis for each graph is 21.3%, 19.3%, 13.6%, and 12.7%, respectively

