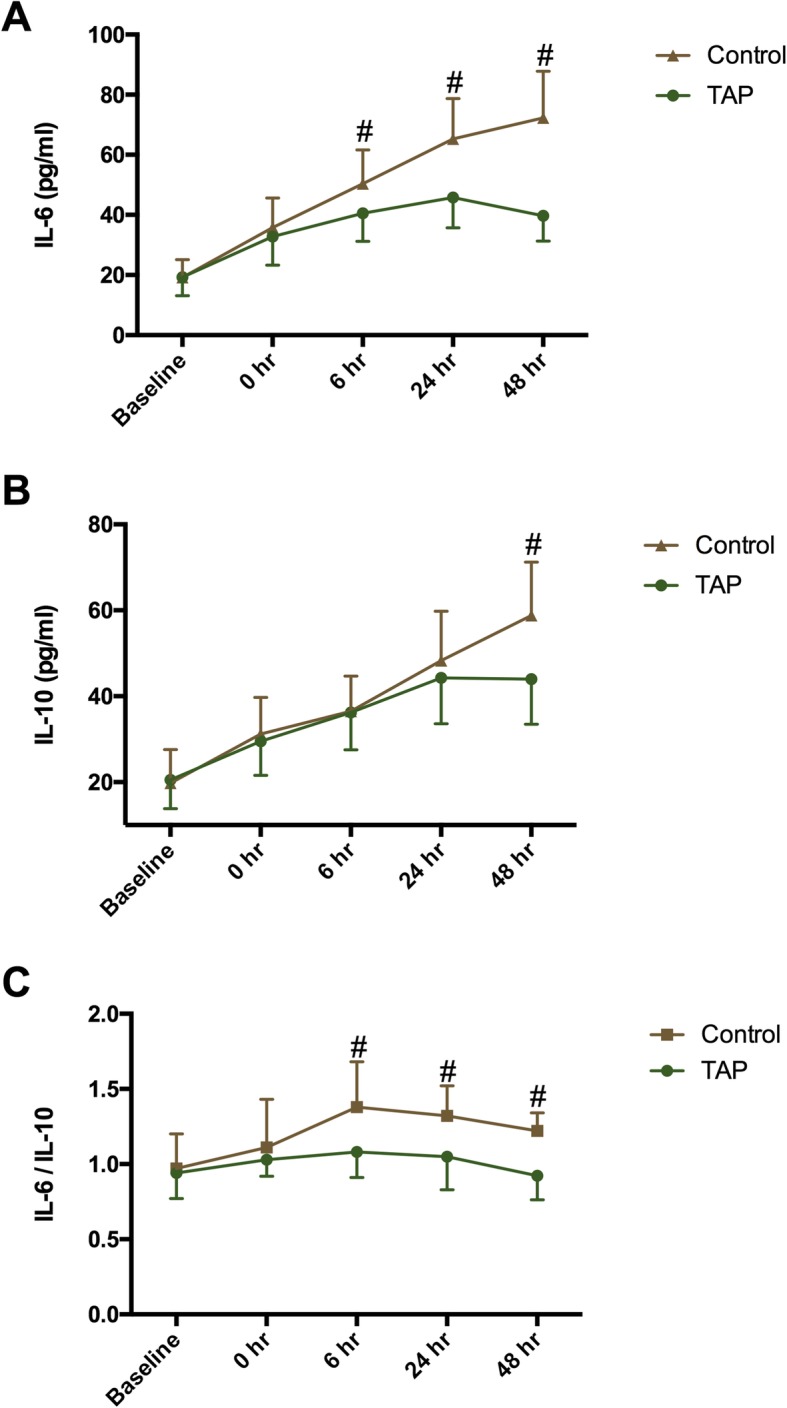
Fig. 2.

Serum concentration of interleukin (IL)-6 (a), IL-10 (b), and ratio of IL-6/IL-10 (c). TAP: transversus abdominis plane. Time interval is defined as time between baseline and postoperative time. Data are expressed as mean ± SD. #: P < 0.05 compared with TAP group; *: P < 0.05 compared with baseline
