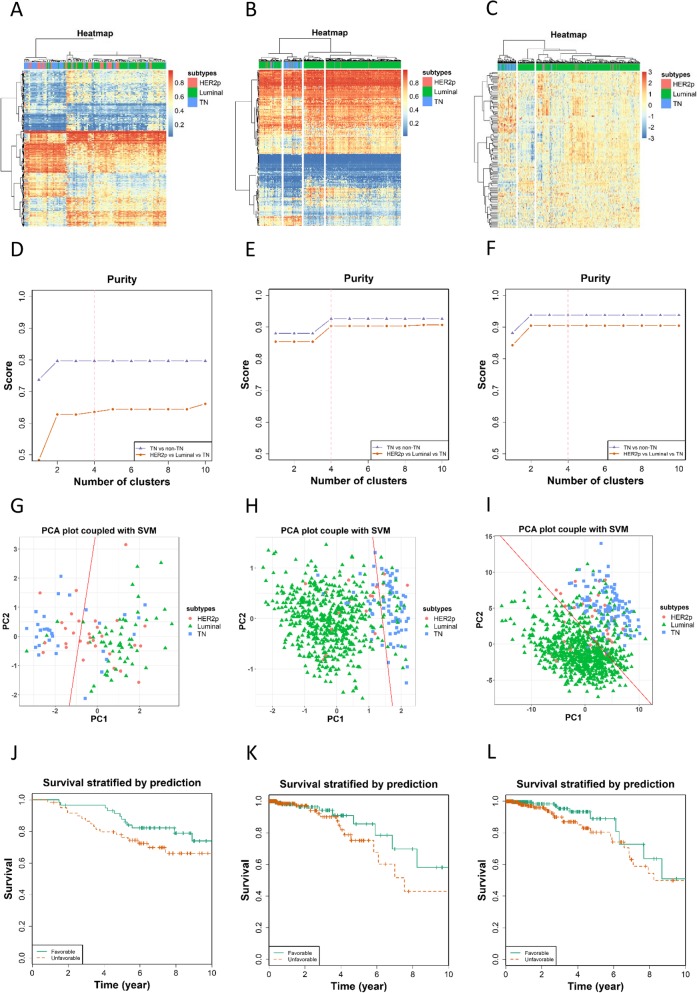
Fig. 4.
Performance validation of pCpGs and pDMGs using the validation datasets. Heatmaps showing breast cancer subtypes classified using (a) pCpGs of GSE72245 on gene methylation, pDMGs of TCGA on (b) gene methylation and (c) gene expression. Purity of clusters obtained from hierarchical clustering using (d) pCpGs of GSE72245 on gene methylation, pDMGs of TCGA on (e) gene methylation, and (f) gene expression. PCA plot coupled with support vector machine in clustering breast cancer samples using (g) pCpGs of GSE72245 on gene methylation, pDMGs of TCGA on (h) gene methylation, and (i) gene expression. Kaplan Meier survival curves stratified using (j) pCpGs of GSE72245 on gene methylation, pDMGs of TCGA on (k) gene methylation and (l) gene expression

