
Fig. 3.
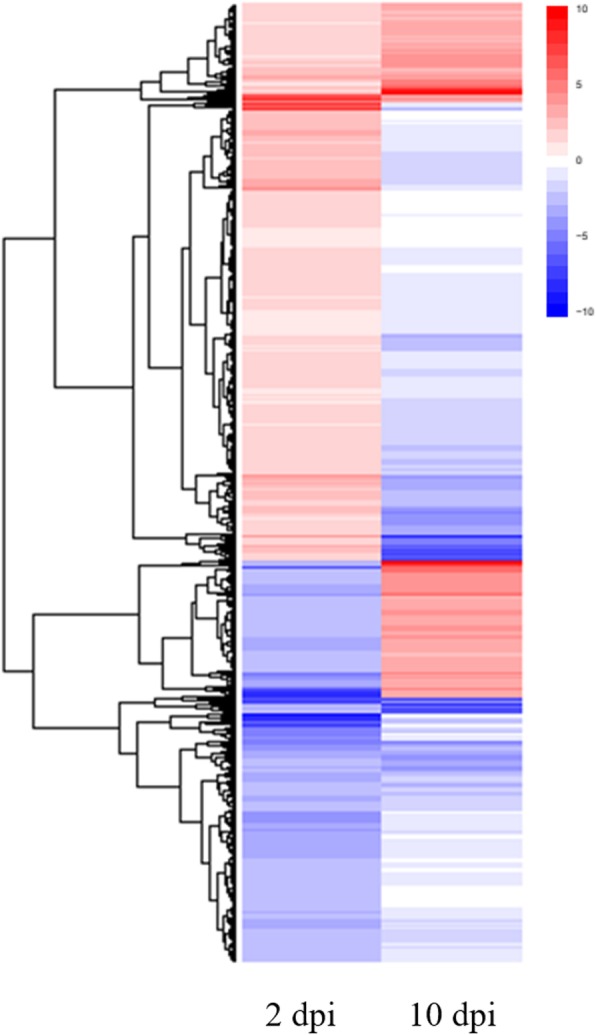
Overall expression patterns of DEGs at 2 and 10 dpi. Heat maps of data sets at 2 (3420 DEGs) and 10 dpi (881 DEGs) are shown. The heat maps were made using the ggplot2 included in R package [36]
Official websites use .gov
A
.gov website belongs to an official
government organization in the United States.
Secure .gov websites use HTTPS
A lock (
) or https:// means you've safely
connected to the .gov website. Share sensitive
information only on official, secure websites.
Overall expression patterns of DEGs at 2 and 10 dpi. Heat maps of data sets at 2 (3420 DEGs) and 10 dpi (881 DEGs) are shown. The heat maps were made using the ggplot2 included in R package [36]