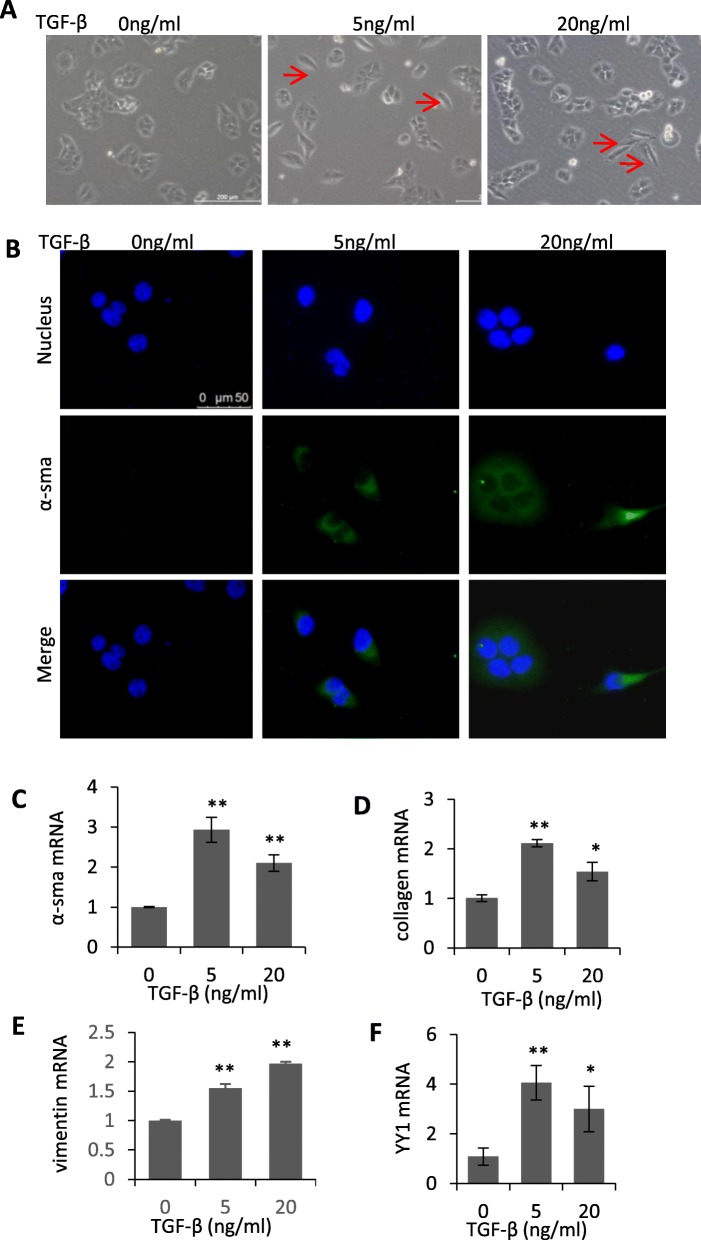
Fig. 2.
Upregulation of YY1 was associated with the TGF-β induced EMT and pro-fibrotic changes in A549 cells. a Morphological change of A549 cells induced by different concentrations of TGF-β. The arrows indicated representative profibrotic cells. Scale bar: 200 μm. b Immunofluorescence staining demonstrated the induction of α-sma by 0, 5 and 20 ng/ml of TGF-β treatment. Scale bar: 50 μm. c-f Quantitative RT-PCR analysis of mesenchymal and pro-fibrotic markers including α-sma (c), collagen (d), vimentin (e) and YY1 (f) in A549 cells before or after treatment with 5 and 20 ng/ml of TGF-β. TGF-β was applied for 48 h. Data are presented as mean ± SEM (n = 3). All comparisons were made with TGF-β-treated cells vs untreated cells. *p < 0.05, **p < 0.01

