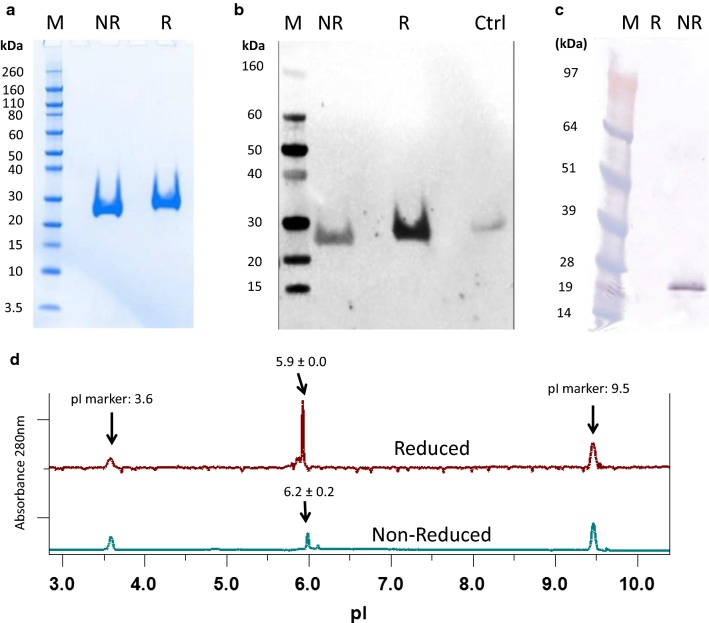
Fig. 2.
Electrophoresis of purified Pfs230 D1+. a SDS-PAGE and b anti-His Western blot analysis. c Western blot analysis of Pfs230D1+ using mouse monoclonal antibody 15A4-1B12. Lanes are labeled as follows: Pre-stained molecular weight markers (M); non-reduced samples (NR), reduced samples (R), an irrelevant His-tagged protein used as a positive control for Western blot (Ctrl). d Representative cIEF electropherograms of Pfs230D1+. A single peak was observed for reduced (~ 5.9) and non-reduced Pfs230DI+ (~ 6.2), which were close to the theoretical pI of 5.6. The reported averages ± 1SD were calculated from three independent experiments

