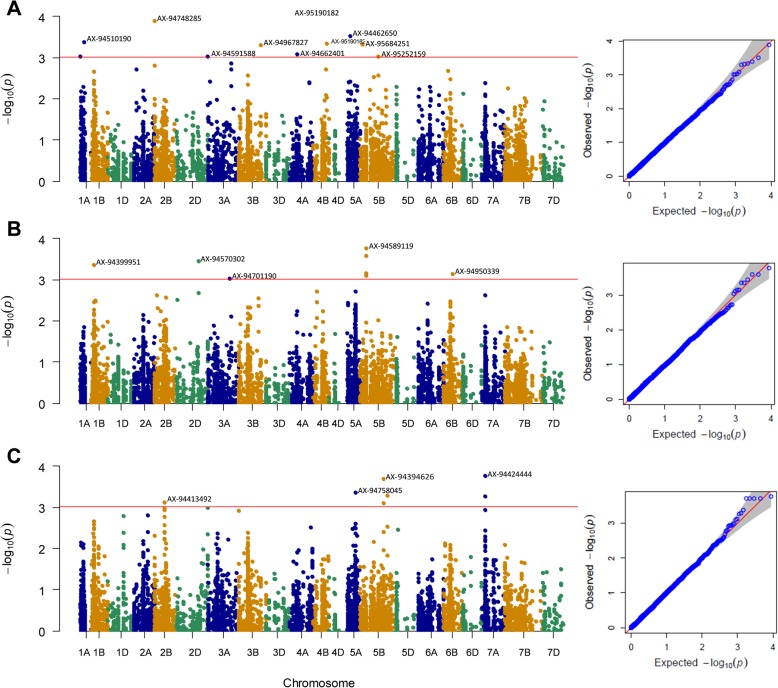
Fig. 4.
Genome-wide association scan. Mixed linear model (MLM) based Manhattan plots represent–log10 (p-value) for SNPs distributed across all 21 chromosomes of wheat. a Pyrenophora tritici-repentis race 1 (Ptr race 1); b Pyrenophora tritici-repentis race 5 (Ptr race 5); c Stagonospora nodorum blotch (SNB). Y-axis:–log10 (p-value) and x-axis: wheat chromosomes. The horizontal lines stand as a threshold for significant markers with–log10 (p-value) of > 3 which corresponds to a p-value < 1 × 10− 3. On the right side of each model, Quantile-Quantile (QQ) plots represent the expected null distribution of p-values vs observed p-values

