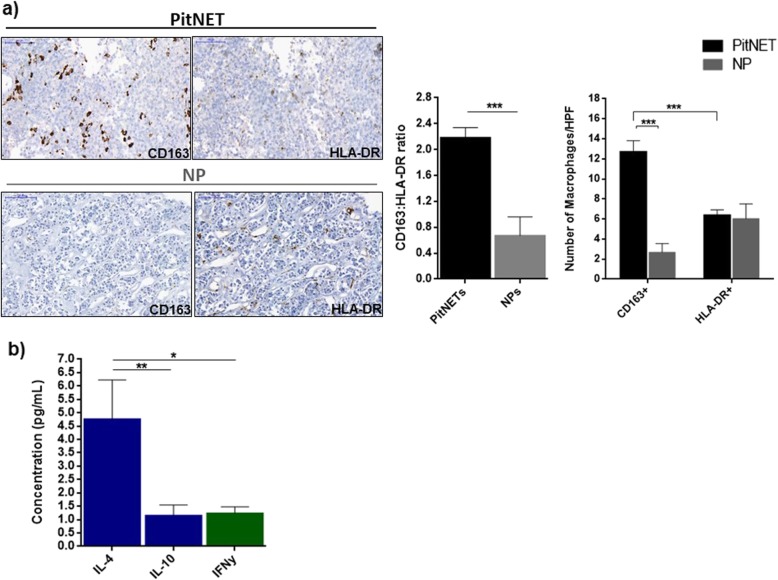
Fig. 3.
a Immunohistochemical analysis of CD163+ and HLA-DR+ macrophages in PitNETs and normal pituitary (NP). Data are shown as mean ± standard error of the mean (SEM) for CD163:HLA-DR ratio and for the number of CD163-positive and HLA-DR-positive cells per high power field (HPF). Representative images are shown for a PitNET and NP. Scale bar 50 μm. PitNETs, n = 24; NP, n = 5. ***, < 0.001 (Mann Whitney U test). b Macrophage-polarising cytokines in PitNET culture supernatants. Supernatants were collected at 24 h in serum-free medium conditions and cytokine secretome determined with the human Millipore MILLIPLEX cytokine 42-plex array. Results are shown as mean ± SEM for IL-4 and IL-10 (M2-polarising cytokines, blue bars) and IFNγ (M1-polarising cytokine, green bar). *,< 0.05, **,< 0.01 (one-way ANOVA with Bonferroni multiple comparison test)

