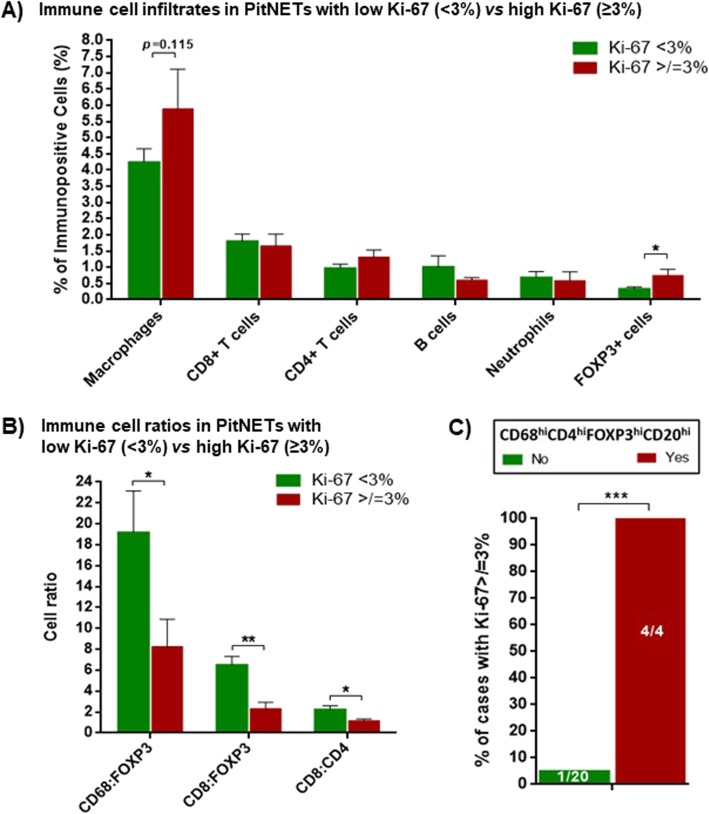
Fig. 5.
Immune cell infiltrates (a) and immune cell ratios (b) in PitNETs with lower (< 3%) vs higher (≥3%) Ki-67. PitNETs with lower Ki-67, n = 19; PitNETs with higher Ki-67, n = 5. *, < 0.05, **, <0.01 (Mann Whitney U test). c) Percentage of PitNETs with Ki-67 ≥ 3% according to the presence of a “deleterious immune infiltrate phenotype”, i.e. higher content of macrophages, CD4+ T helper lymphocytes, FOXP3+ T regulatory cells and B cells (CD68hiCD4hiFOXP3hiCD20hi). PitNETs with “deleterious immune infiltrate phenotype”, n = 4; PitNETs without “deleterious immune infiltrate phenotype”, n = 20. ***, <0.001 (Exact Fisher’s test)

