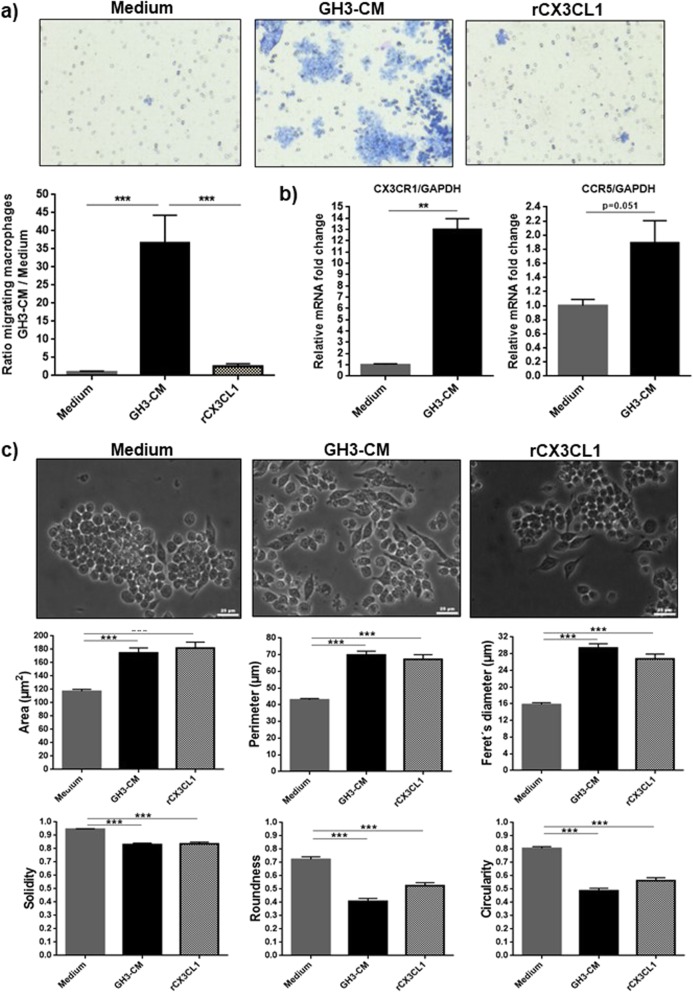
Fig. 7.
a Transwell chemotaxis assay performed on RAW 264.7 macrophages towards complete medium, GH3-CM and recombinant CX3CL1 (rCX3CL1) at concentration 100 ng/mL for 72 h. Data are shown as mean ± standard error of the mean (SEM) for the ratio of migrated RAW 264.7 macrophages towards GH3-CM or rCX3CL1 in relation to migrated macrophages in complete medium. n = 6. ***, <0.001 (one way-ANOVA with Bonferroni multiple comparison test). b CX3CR1 and CCR5 expression in RAW 264.7 macrophages determined by RT-qPCR after treatment with GH3-CM for 24 h vs complete medium. Data are shown as mean ± SEM for CX3CR1 or CCR5 relative fold change expression to GAPDH, determined by the ∆∆CT method. n = 3. **, <0.01 (Mann Whitney U test). c Morphological evaluation of RAW 264.7 macrophages after treatment for 72 h with complete medium (n = 3), GH3-CM and rCX3CL1 at concentration of 100 ng/mL. Data are shown as mean ± SEM for the 6 morphological parameters evaluated by Image J: cell area (μm2), Feret’s diameter (μm), solidity (0–1), perimeter (μm), roundness (0–1) and circularity (0–1). Per experiment 75 cells were analysed, with a minimum of 3 experiments per treatment condition. Scale bar 25 μm. ***, <0.001 (one-way ANOVA with Bonferroni multiple comparison test)

