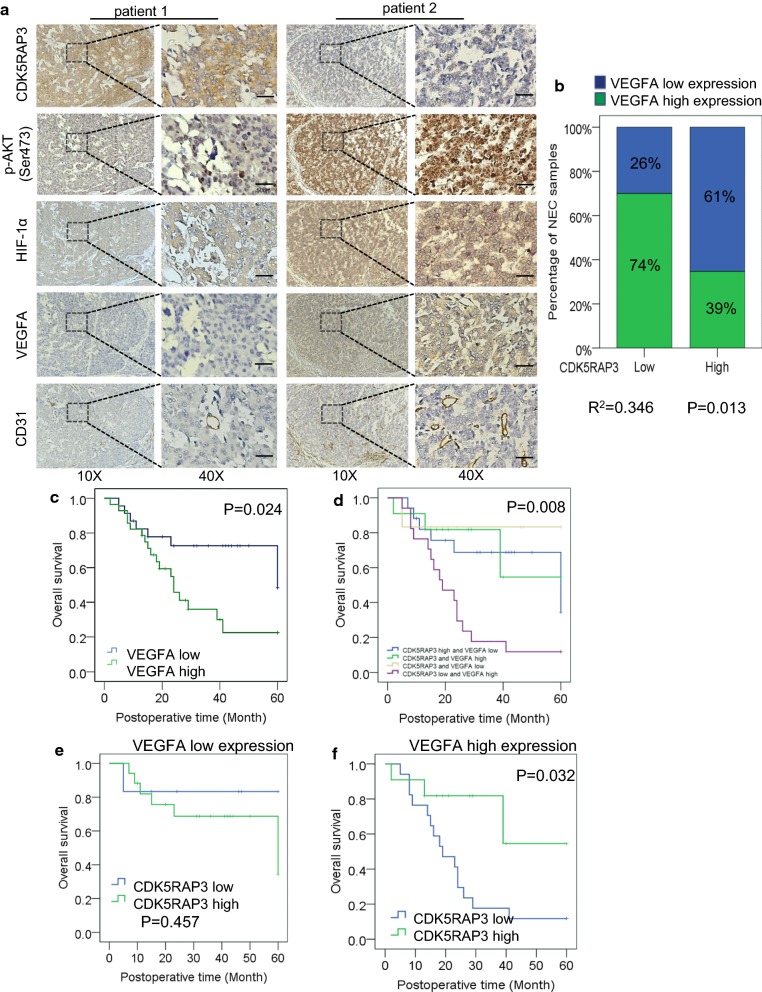
Fig. 5.
Correlation and prognostic value of CDK5RAP3 and VEGFA in GNEC patients. a Representative IHC staining of CDK5RAP3, HIF-1α, p-AKT (S473), CD31 and VEGFA in two GNEC cases (magnification, 10X and 40X, Scale bar, 50 µm). b IHC scores of CDK5RAP3 and VEGFA in GNEC tissues. CDK5RAP3 and VEGFA expression are inversely correlated in GNEC tissues (R2 = 0.346, P < 0.05, log-rank test). c Kaplan–Meier survival curve of gastric cancer patients with “VEGFA high” and “VEGFA low” (P < 0.05, log-rank test) tumors. d Kaplan–Meier survival curve of patients with low and high VEGFA expression as well as those with low or high CDK5RAP3 expression (P < 0.05, log-rank test). e Kaplan–Meier survival curve of patients with VEGFA low expression and low and high CDK5RAP3 expression (P > 0.05, log-rank test). f Kaplan–Meier survival curve of patients with VEGFA high expression and low and high CDK5RAP3 expression (P < 0.05, log-rank test)

