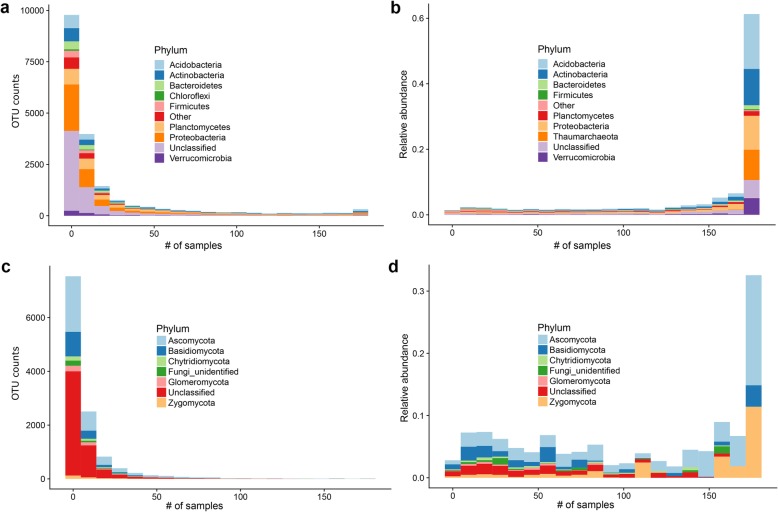
Fig. 2.
Core and specific bacterial and fungal microbiome. a Distribution of the number of bacterial OTUs that are specific to a given number of samples, classified at the Phylum level. Only the eight more representative taxa are shown. The remaining reads are either “unclassified” or annotated as “other”. b Total relative abundance of bacterial OTUs that are specific to a given number of samples. c distribution of the number of fungal OTUs that are specific to a given number of samples, classified at the Phylum level. Only the seven more representative taxa are shown. The remaining reads are either “unclassified” or annotated as “other”. d Total relative abundance of fungal OTUs that are specific to a given number of samples

