Figure 2.
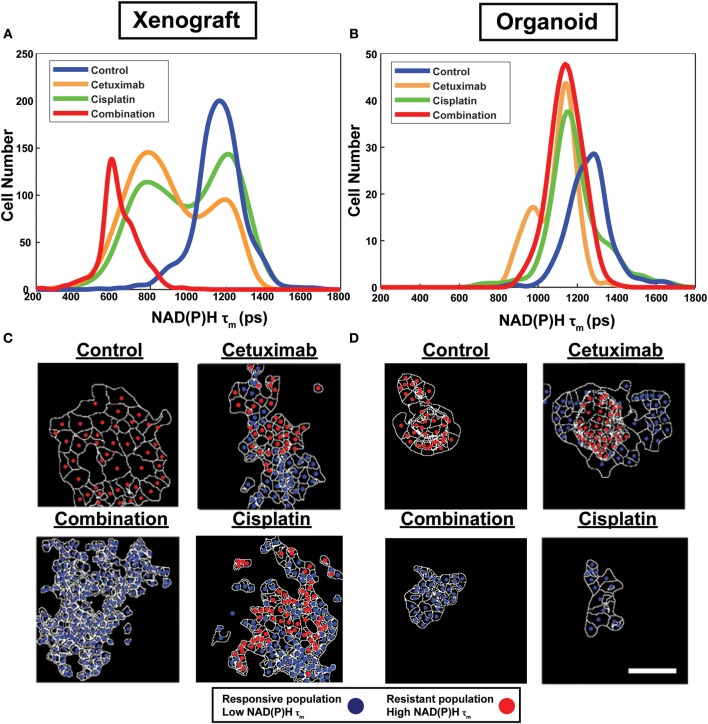
Sub-population distributions and population mapping visualize treatment-dependent spatial heterogeneity within FaDu xenografts and organoids. Population density modeling of single cell measurements of NAD(P)H τm in FaDu (A) xenografts and (B) organoids reveal heterogeneous cell populations within control, cetuximab-treated, cisplatin-treated, or cetuximab and cisplatin-treated (combination) groups. Representative population maps of control and treated (C) xenografts and (D) organoids demonstrate spatial organization of cell populations with differing treatment response. Individual cells are color-coded based on the population assignment determined from density-based clustering analysis. Responsive populations, corresponding to low NAD(P)H τm, are coded red, and resistant populations, corresponding to high NAD(P)H τm, are coded blue. Cell outlines are in white. Scale bar, 50 μm.

