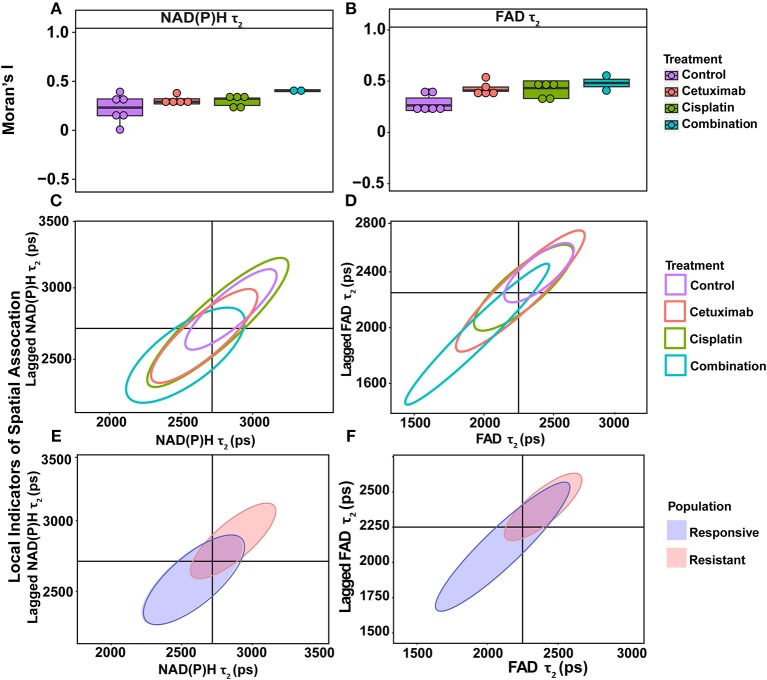
Figure 4.
Spatial clustering patterns of OMI variables in FaDu xenografts. Moran's I based on (A) NAD(P)H τ2 and (B) FAD τ2 measurements is plotted across control and treated xenografts. (C–F) Ellipses represent the distribution of cell clusters, with cells falling in the upper right (homogeneously high value clusters) and lower left quadrants (homogeneously low value clusters). Clustering is plotted for each treatment group for (C) NAD(P)H τ2 and (D) FAD τ2. Clustering is similarly plotted for responsive and resistant cells for (E) NAD(P)H τ2 and (F) FAD τ2.

