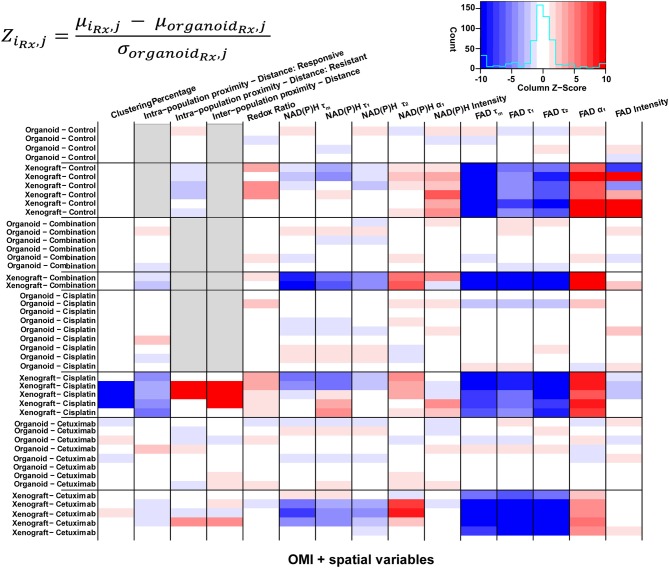
Figure 7.
Z-scores of metabolic and spatial variables in control and treated xenografts and organoids. Heatmap of Z-scores across treatment groups and model systems (organoid and xenograft). Each Z-score is calculated for each sample of a given treatment group (iRx) and variable (j) as the difference between the mean variable per sample and the mean variable across all organoids of the corresponding treatment group (organoidRx) divided by the standard deviation of the organoid treatment group. Z-score differences within a single treatment group represent variability across samples. Gray boxes indicate samples without a value for a given variable, specific to xenograft and organoid treatment groups with a single population.

