
. 2019 Oct 25;22(4):447–452. doi: 10.4103/aian.AIAN_349_18
Copyright: © 2006 - 2019 Annals of Indian Academy of Neurology
This is an open access journal, and articles are distributed under the terms of the Creative Commons Attribution-NonCommercial-ShareAlike 4.0 License, which allows others to remix, tweak, and build upon the work non-commercially, as long as appropriate credit is given and the new creations are licensed under the identical terms.
Figure 1.
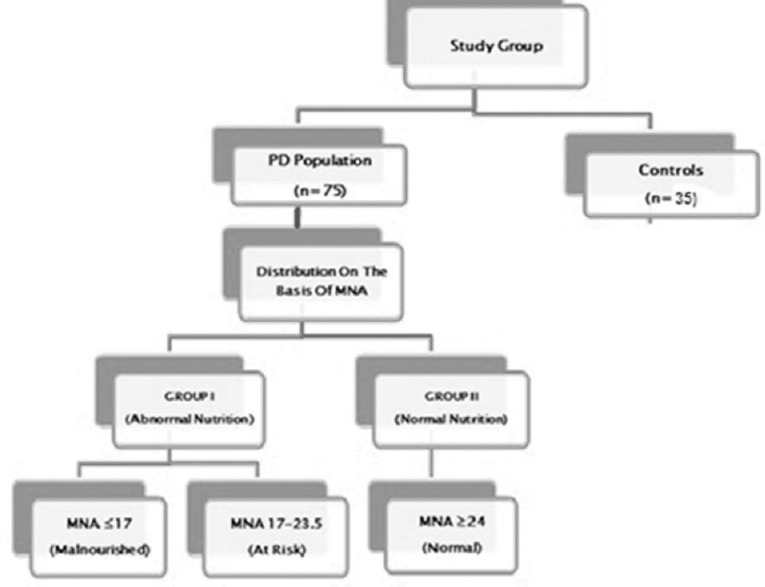
Distribution of the studied population