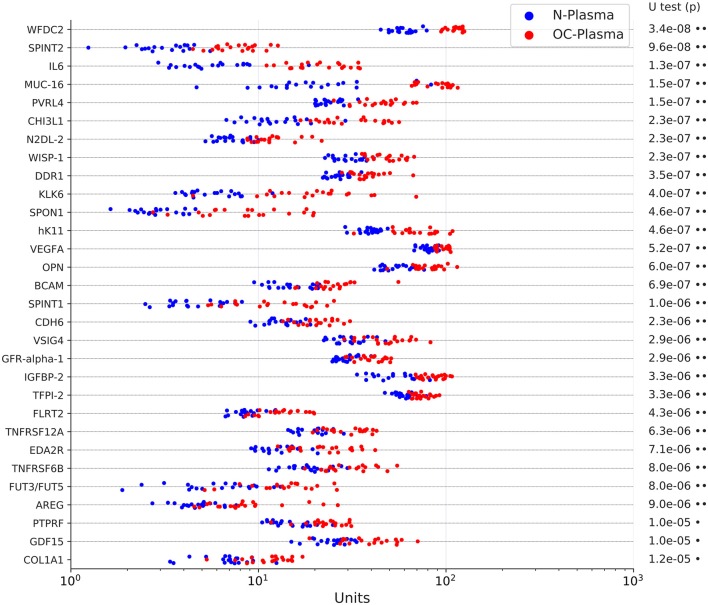
Figure 1.
Levels of the top 30 upregulated proteins in OC-plasma (red) vs. N-plasma (blue) based on PEA signals. The dot plots show the results for 20 OC-plasma and 20 N-plasma samples. The indicated p-values were determined by Mann-Whitney U test and adjusted for multiple hypothesis testing by Benjamini-Hochberg correction. X-axis units represent normalized intensity PEA signals. Dots next to the p-values indicate the extent of significance: •p < 1e-3, ••p < 1e-5.

