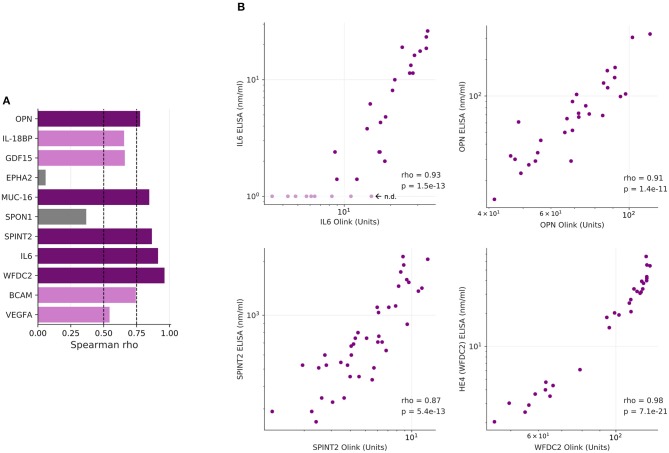
Figure 4.
Correlation of PEA and ELISA data. (A) Spearman correlations for the markers determined in Figure 3. Dark purple: ρ > 0.75; light purple: 0.75 ≥ ρ > 0.5; gray: 0.5 ≥ ρ > 0. (B) Dot plots showing highly significant positive correlations of PEA and SOMAscan data (n = 30) for IL-6, OPN, CA125/MUC16, and HE4/WFDC2.

