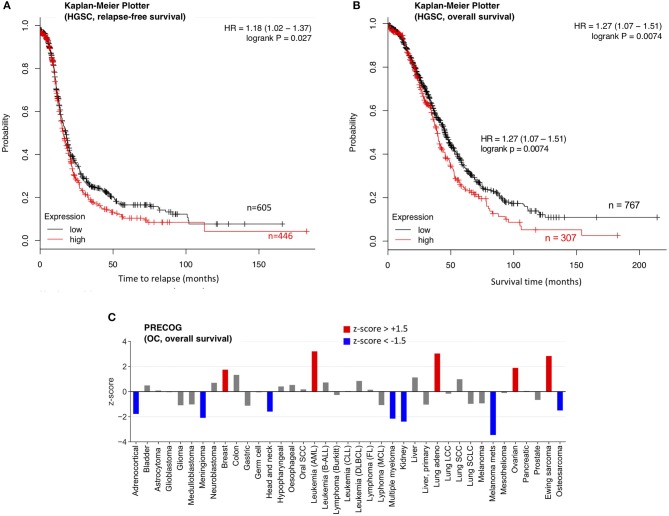
Figure 6.
Association of SPINT2 mRNA expression with survival of OC patients. (A) Kaplan-Meier plot for 1074 HGSC patients in the Kaplan–Meier Plotter database (31) (updated version at http://kmplot.com) analyzing the association of SPINT2 with RFS. HR, hazard ratio. (B) Kaplan-Meier plot for 1074 HGSC patients in the same database analyzing the association of SPINT2 with OS. (C) z-scores (PRECOG data) for the association of SPINT2 with the overall survival (OS) of the indicated tumor entities (32). Red: association with a short OS (z-score above +1.5;). Blue: association with a short OS (z-score below −1.5).

