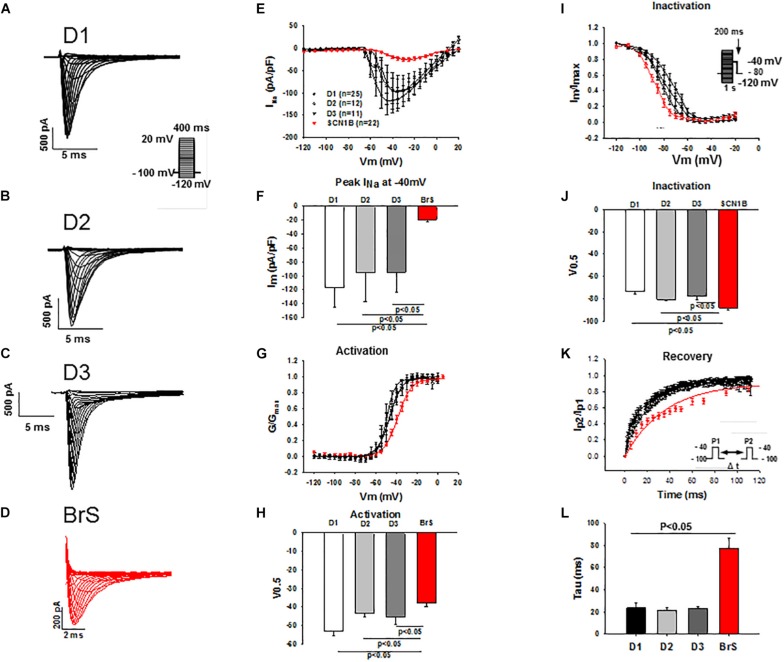
FIGURE 3.
Peak INa was reduced in hiPSC-CMs from the BrS-patient. Peak INa was recorded with the protocol shown in panel A (inset) in hiPSC-CMs from donors (D1, D2, D3) and the BrS patient. The measured peak currents were plotted against voltages to obtain the current-voltage relationship (I-V) curves. INa was divided by the driving force (V-Vres, where V presents the voltage at each step, Vres represents the reverse potential for Na+ current) to obtain the conductance (G), which is in turn normalized to maximum (G/Gmax) and plotted against voltages to obtain the activation curves. For assessing the inactivation of sodium channels INa was recorded with the protocol indicated in I (inset) and the inactivation curves were obtained. Both activation and inactivation curves were fitted by Boltzmann equation to get the values of 50% activation or inactivation (V0,5) of sodium channels. For assessing the recovery of the channel INa was recorded with the double-pulse protocol (inset in panel K). The currents evoked by the second pulse were normalized to that evoked by the first pulse and then plotted against the time intervals between the two pulses. The recovery curves were fitted by single exponential equation to get the time constant (tau). (A–D) Representative traces of INa in hiPSC-CMs from healthy donors and the BrS patient. (E,F) I-V curves and INa at –40 mV showing a reduced peak INa in hiPSC-CMs from donors and the BrS patient. (G,H) Activation curves and the voltage values at 50% activation (V0.5). (I,J) Inactivation curves and the voltage values at 50% inactivation (V0.5). (K,L) Curves and tau values of recovery from inactivation. n, number of cells.

