FIGURE 4.
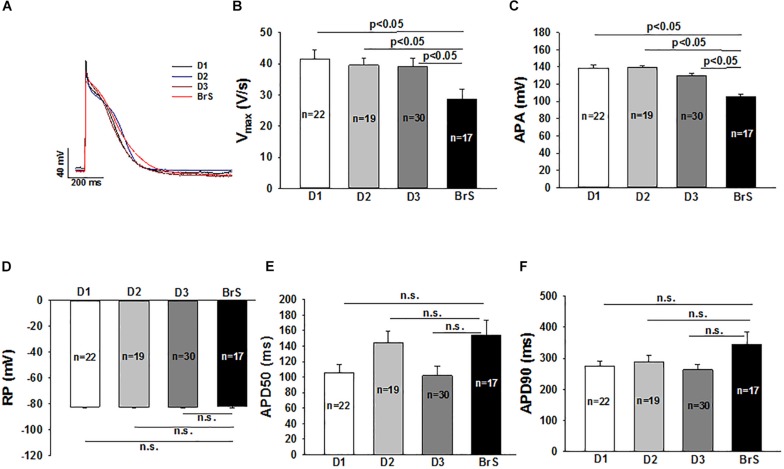
Changes of action potential in hiPSC-CMs from the BrS patient. Action potentials (AP) were evoked by pulses of 1 nA for 3 ms at 1 Hz in current clamp mode. When APs reached steady state, 10 sequential APs were recorded and mean values were calculated for each cell. All the parameters of APs were compared between cells from donors (D1, D2, D3) and the BrS patient. (A) Representative traces of APs in donor cells (D1, D2, and D3) and BrS cells. (B) Mean values of maximal depolarization velocity (Vmax) of action potentials. (C) Mean values of action potential amplitude (APA). (D) Mean values of resting potentials (RP). (E) Mean values of action potential duration at 50% repolarization (APD50). (F) Mean values of action potential duration at 90% repolarization (APD90). n, number of cells; n.s., not statistically significant (p > 0.05).

