Figure 3.

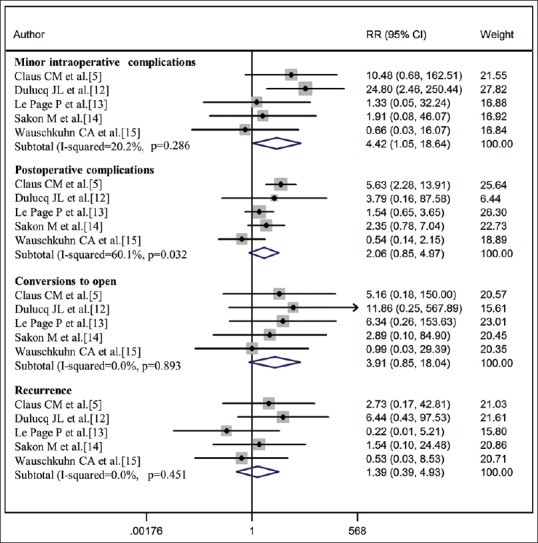
Forest plot of the statistical analysis. It is described the Risk Ratios, the 95% confidence interval and the subtotal I-squared for all the studies included

Forest plot of the statistical analysis. It is described the Risk Ratios, the 95% confidence interval and the subtotal I-squared for all the studies included