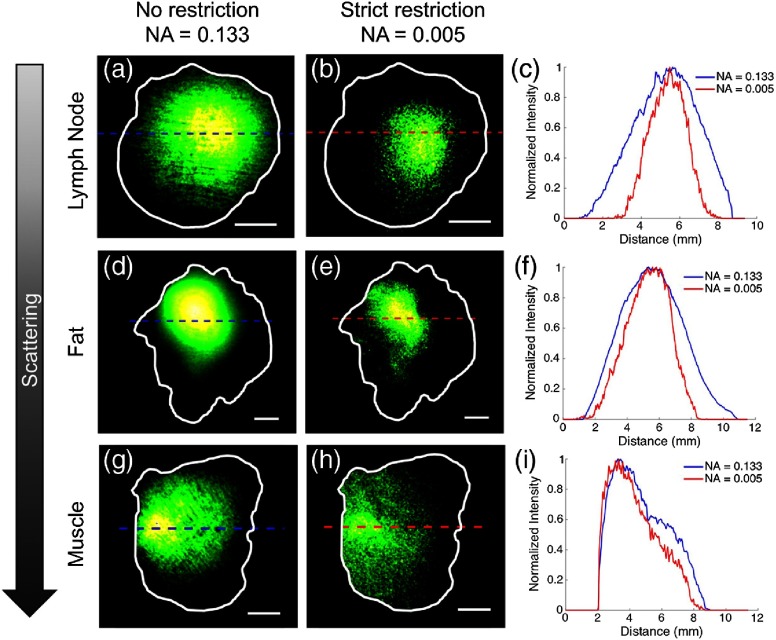
Fig. 2.
Porcine tissues (top row, lymph node; middle row, fat; and bottom row, muscle) embedded with a fluorescent inclusion. Tissues are ordered to represent expected levels of optical scattering increasing from top to bottom. Columns display: false-colored fluorescence images from a single tomographic view using (a), (d), (g) no angular restriction (); (b), (e), (h) strict angular restriction (). (c), (f), (i) Corresponding line profiles of normalized signal intensity. Tissue structures are outlined in white and scale bars are all 2 mm. Dashed lines indicate the center of 100 averaged rows of the intensity profiles plotted for zero and strict constriction in blue and red, respectively.

