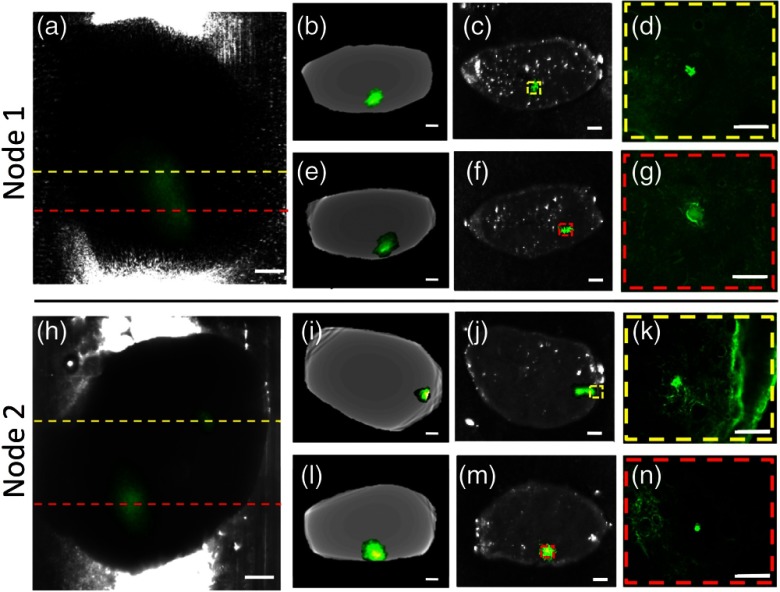
Fig. 3.
Porcine lymph nodes implanted with GFP-labeled human breast cancer cell (MDA-MB-231) spheroids. Columns from left to right: (a), (h) false-colored fluorescence overlaid onto transmittance images from a single tomographic view (scale bar 1 mm); (b), (e), (i), (l) angle-restricted fluorescence OPT FBP reconstructed virtual sections at the height of detected cells indicated by yellow and red dashed lines (scale bar 1 mm); (c), (f), (j), (m) Pearl images (fluorescence overlaid on to white light) of lymph node sections sliced at the same heights (scale bar 1 mm); (d), (g), (k), (n) fluorescent microscope images of the regions outlined in dashed boxes (scale bar ). Top and bottom rows for each node correspond to top (yellow dashed lines) and bottom (red dashed lines) detected micrometastases, respectively.

