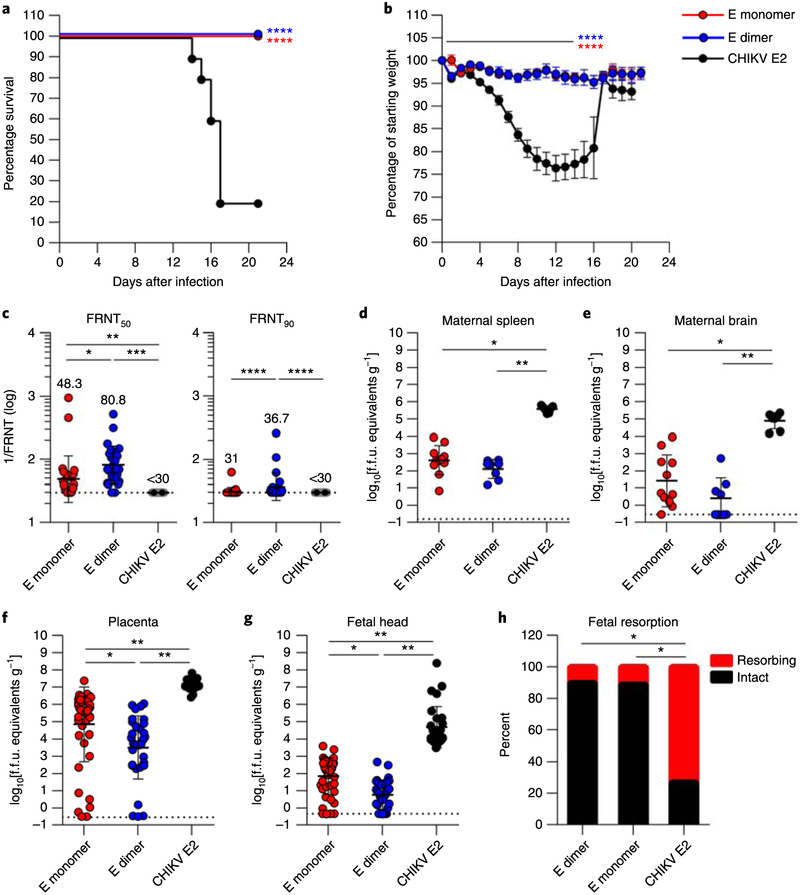
Fig. 5 |. The E-dimer vaccine protects against ZIKV infection in C57BL/6 mice.
a,b, Survival (a) and weight loss data (b) obtained from immunized wild-type C57BL/6 mice (n = 10 animals from two independent experiments) after challenge with ZIKV Dakar 41519. Survival data were analyzed by two-sided log-rank test. Weight loss was analyzed by Tukey–Kramer multiple comparison test for surviving animals. In b, the line indicates days with statistically significant differences compared with the CHIKV E2 vaccine, and data are presented as means ± s.d. c, ZIKV neutralization activity of serum collected 12 weeks post-prime. EC50 (effective concentration of half-maximal inhibition, 1/FRNT50; left) and EC90 values (1/FRTN90; right) against ZIKV were calculated for individual animals in each group. The dashed lines indicate the limit of detection of the assay. Data were analyzed by Kruskal–Wallis test with Dunn’s post-test. Individual measurements, as well as geometric mean ± s.d. values are noted (n = 25 individual mouse serum samples per group; 15 females and 10 males), d–g, ZIKV burden of immunized dams challenged with ZIKV Dakar 41525. Results are given for the maternal tissues (spleen (d) and brain (e); n = 7,11 and 8 animals for the CHIKV E2, E-monomer and E-dimer groups, respectively), placenta (f; n = 28,44 and 32 samples for the CHIKV E2, E-monomer and E-dimer groups, respectively) and fetal head (g; n = 28, 44 and 32 samples for the CHIKV E2, E-monomer and E-dimer groups, respectively) harvested on E13. Data were analyzed by Kruskal–Wallis analysis of variance with Dunn’s post-test. Solid bars denote median values, and dashed lines mark the limit of detection of each assay, h, Fetal resorption was assessed at the time of harvest (n = 79,105 and 68 samples for the CHIKV E2, E-monomer and E-dimer groups, respectively). The data were analyzed by chi-squared test. In all panels with P values: *P < 0.05; **P < 0.01; ***P < 0.001; ****P < 0.0001.

