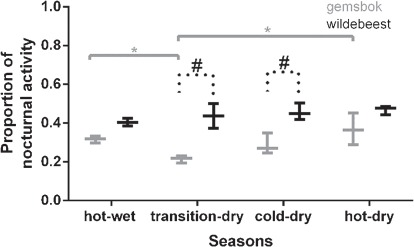
Figure 2.

A boxplot showing the proportion of 24-h activity that occurred during the night (sunset to sunrise) for gemsbok (n = 3, grey bar) and wildebeest (n = 3, black bar) over the four seasons. The hashtags represent the difference between species, and significance bars represent the difference between seasons. *P < 0.05.
