
Figure 6.
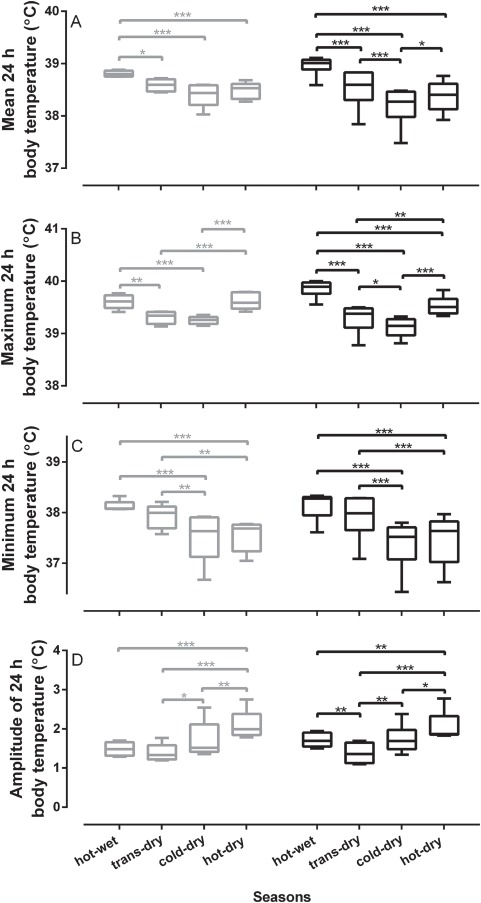
A boxplot showing the comparison of the profile of the 24-h body temperature rhythm between two sympatric species. (A) mean, (B) maximum, (C) minimum and (D) amplitude of the 24-h body temperature rhythm of gemsbok (n = 5, grey bar) and wildebeest (n = 6, black bar) over the four seasons. The horizontal bars represent significant differences between seasons. *P < 0.05, **P < 0.01, ***P < 0.001.