Figure 1.

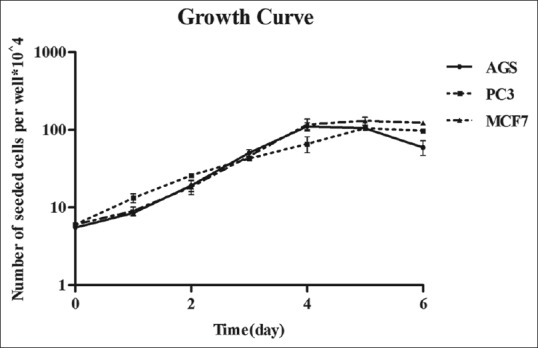
Cellular growth curves were determined for AGS, PC3, and MCF7 cells by trypan blue (counting dye technique). Data are mean ± standard error of the three independent experiments

Cellular growth curves were determined for AGS, PC3, and MCF7 cells by trypan blue (counting dye technique). Data are mean ± standard error of the three independent experiments