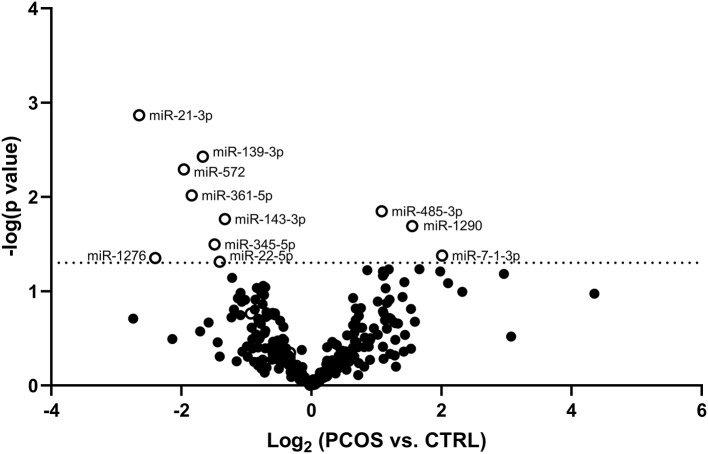
Figure 1.
Volcano plot displaying differences in circulating miRNA levels between PCOS women and Controls. Volcano plot based on miRNA mean fold changes between PCOS patients vs. Control subjects. Open circles indicate significantly [p < 0.05; –log (p-value) of −1.3, dotted line] increased or decreased relative miRNA levels of each miRNA in PCOS patients compared to Control subjects.

