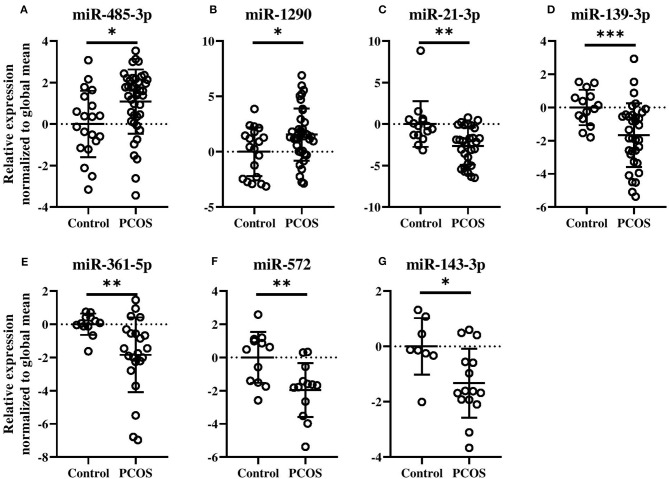
Figure 2.
Levels of circulating miRNA species in PCOS patients compared with Control subjects (A–G). Relative fold changes in miRNA quantities normalized to the global mean. Means and standard deviations are displayed. All indicated p-values were determined by Student's t-test on log2 transformed data. Data were adjusted for age and BMI. p-value * < 0.05, ** < 0.01, *** < 0.0001.

