
Figure 4.
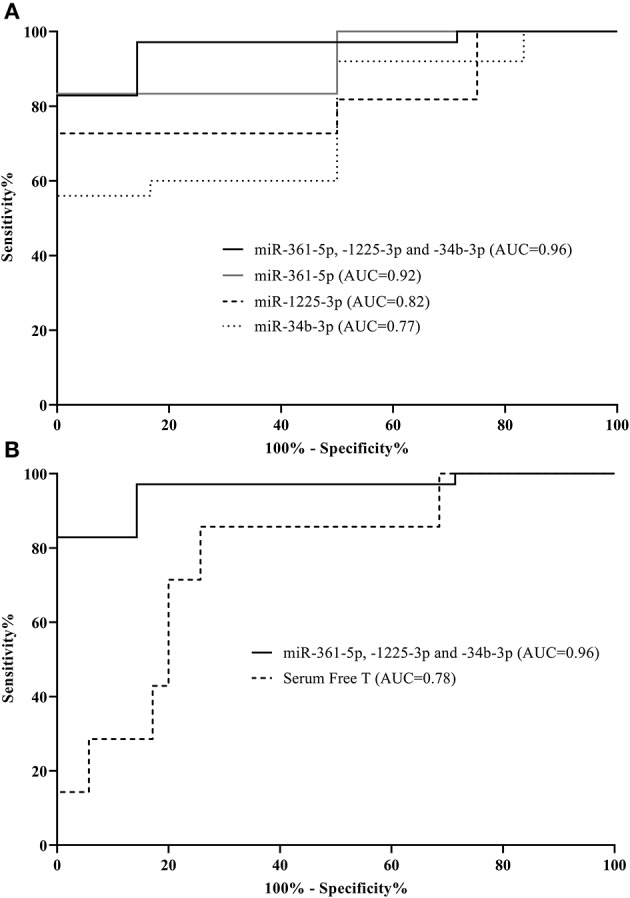
Individual microRNAs are predictive of metabolic syndrome in PCOS women. Receiver operator characteristic curves based on microRNA levels (normalized to global mean). Shown are three microRNAs as well as a combination of these distinguishing between metabolic syndrome cases and those without in the PCOS group (A). Additionally, area under the curves (AUCs) for serum free testosterone compared to the 3-miRNA signature within the PCOS group are displayed (B). The corresponding AUCs and 95% CI: intervals can be found in Supplementary Table 3.