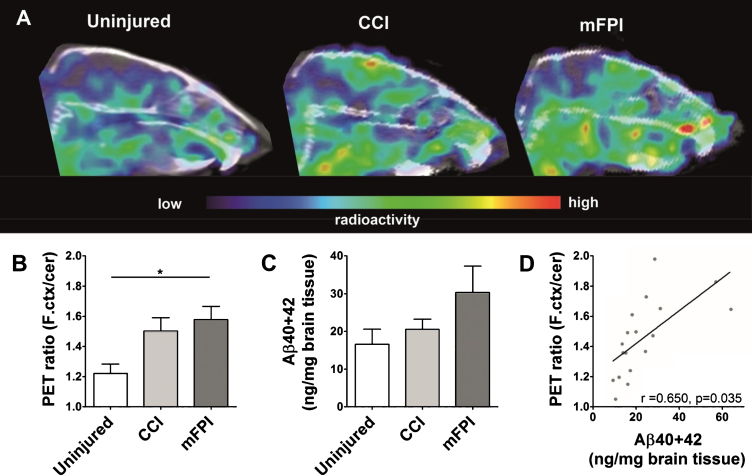
Fig. 2.
Earlier Aβ pathology following TBI. Sagittal view of PET images obtained with [124I]RmAb158-scFv8D3 administered to mice 3 days before scanning (A). Quantification of PET ratio (frontal cortex/cerebellum) from PET images revealed that frontal cortex signal was significantly higher in mice subjected to both forms of TBI compared to uninjured mice (B). ELISA Quantification of total total Aβ40 + 42 in frontal cortex showed a similar trend as PET (C), with a significant correlation to the PET ratio (D). The PET data and the ELISA data were analyzed with one-way ANOVA followed by Bonferroni’s post hoc test. Graphs display group mean with error bars for SEM. *p < 0.05; **p < 0.01.

