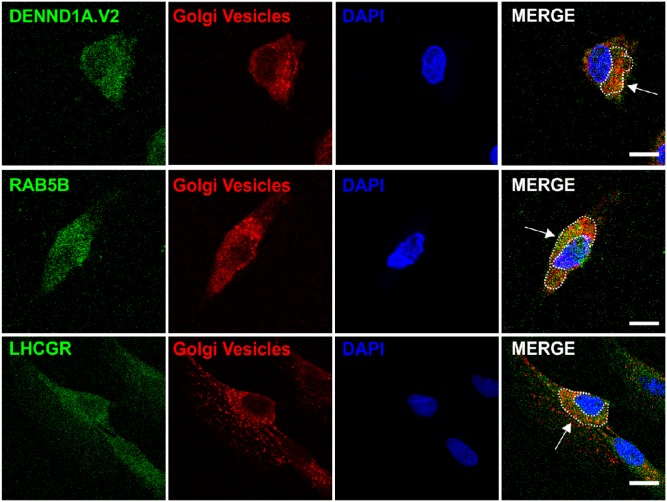
Figure 10.
Representative images of DENND1A.V2, RAB5B, and LHCGR localization in Golgi vesicles. Top panel: DENND1A.V2 and Golgi vesicles, identified by staining with Cy3-labeled Galanthus nivalis lectin/G. nivalis agglutinin. Middle panel: RAB5B and Golgi vesicles. Bottom panel: LHCGR and Golgi vesicles. Scale bars, 10 μm.

