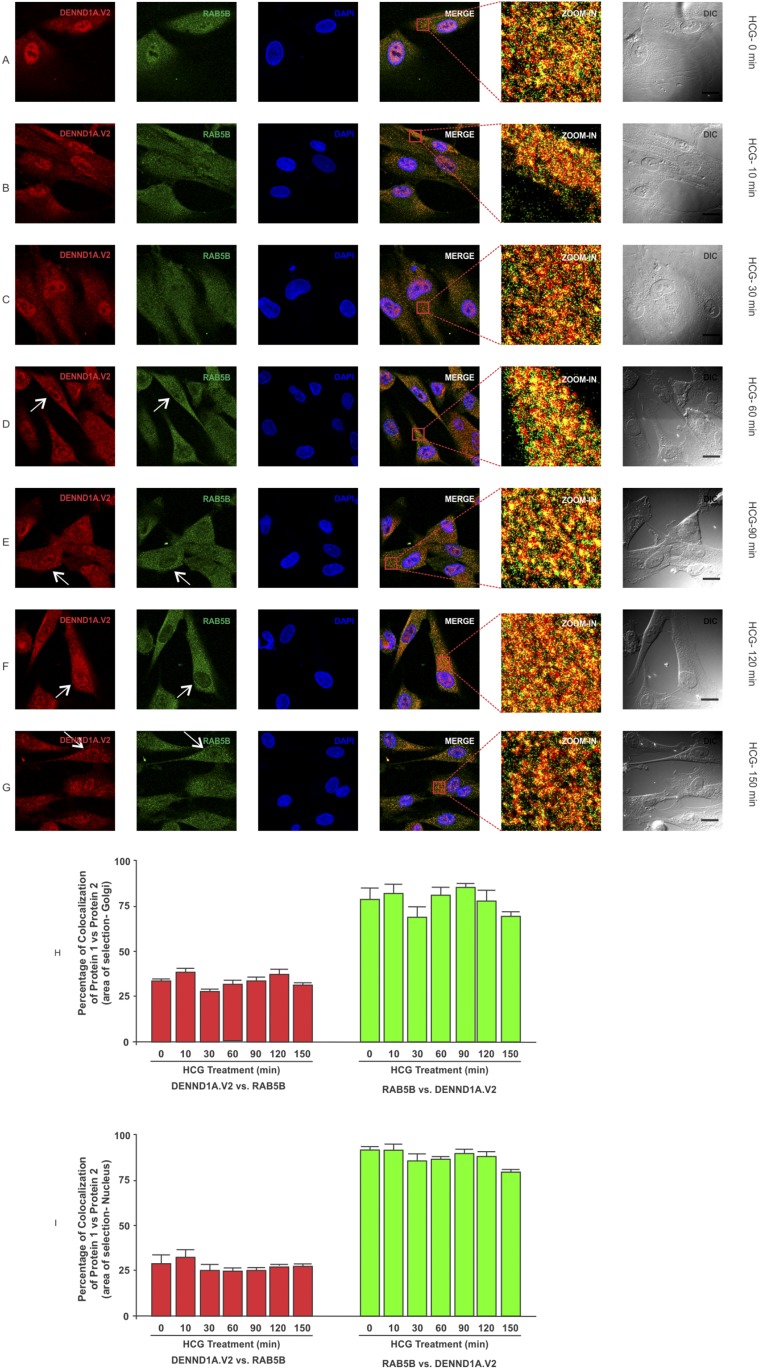
Figure 7.
Time course of hCG treatment of PCOS theca cells and the localization of DENND1A.V2 and RAB5B. Cells were treated with 1 IU/mL hCG for the time points of (A) 0 min, (B) 10 min, (C) 30 min, (D) 60 min, (E) 90 min, (F) 120 min, and (G) 150 min. Increasing concentrations of hCG drive DENND1A.V2 and RAB5B toward the Golgi area (white arrows), but at a later time point than that with normal theca cells. Scale bars, 10 μm. (H) Graph showing high colocalization coefficient of ∼80% for RAB5B with DENND1A.V2 and ∼30% for DENND1A.V2 with RAB5B in Golgi area. (I) Graph showing high colocalization coefficients of ∼80% for RAB5B with DENND1A.V2 and ∼25% for DENND1A.V2 with RAB5B in the nucleus. Representative images from three experiments using three different PCOS theca cell preparations are shown. Data are presented as means ± SE.

