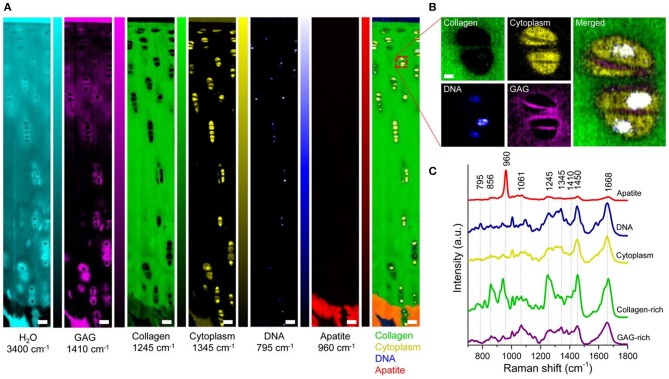
Figure 3.
[Reprinted with permission from Bergholt et al. (2016a)]. Raman spectroscopic imaging of articular cartilage. (A) Univariate Raman spectroscopy images of articular cartilage showing the band intensity associated with H2O (3,400 cm−1), GAG (1,410 cm−1), collagen (1,245 cm−1), cytoplasm (1,345 cm−1), DNA (795 cm−1), apatite (960 cm−1), and the overlay. Scale bar: 50 μm. (B) High-resolution (~0.3 μm) Raman spectroscopy image of chondrocytes and pericellular matrix obtained by imaging the GAG (1,410 cm−1), cytoplasm (1,345 cm−1), and DNA (795 cm−1) against collagen (1,245 cm−1). Scale bar: 3 μm. (C) Representative Raman spectra measured from articular cartilage with marked signatures for specific tissue components.

