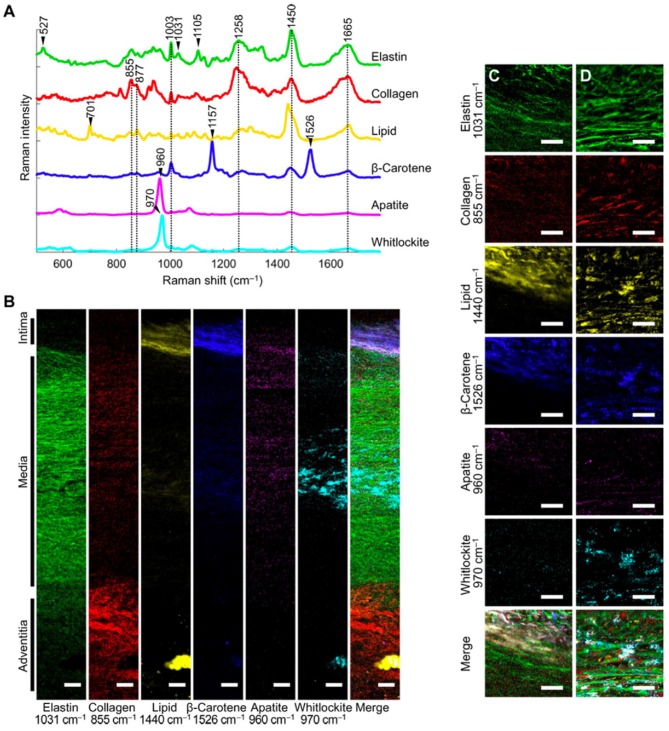
Figure 4.
[Reprinted with permission from You et al. (2017)] (A) Representative spectra rich in specific aortic components. (B) Univariate heat maps of the entire cross section of a non-atherosclerotic aorta were plotted according to the signature peaks listed. (C,D) High-resolution maps at the intima-media interface (C) and within the media (D) were also plotted. Merge refers to a composite image of all the univariate heat maps. Scale bars, 100 μm (B) and 50 μm (C,D).

