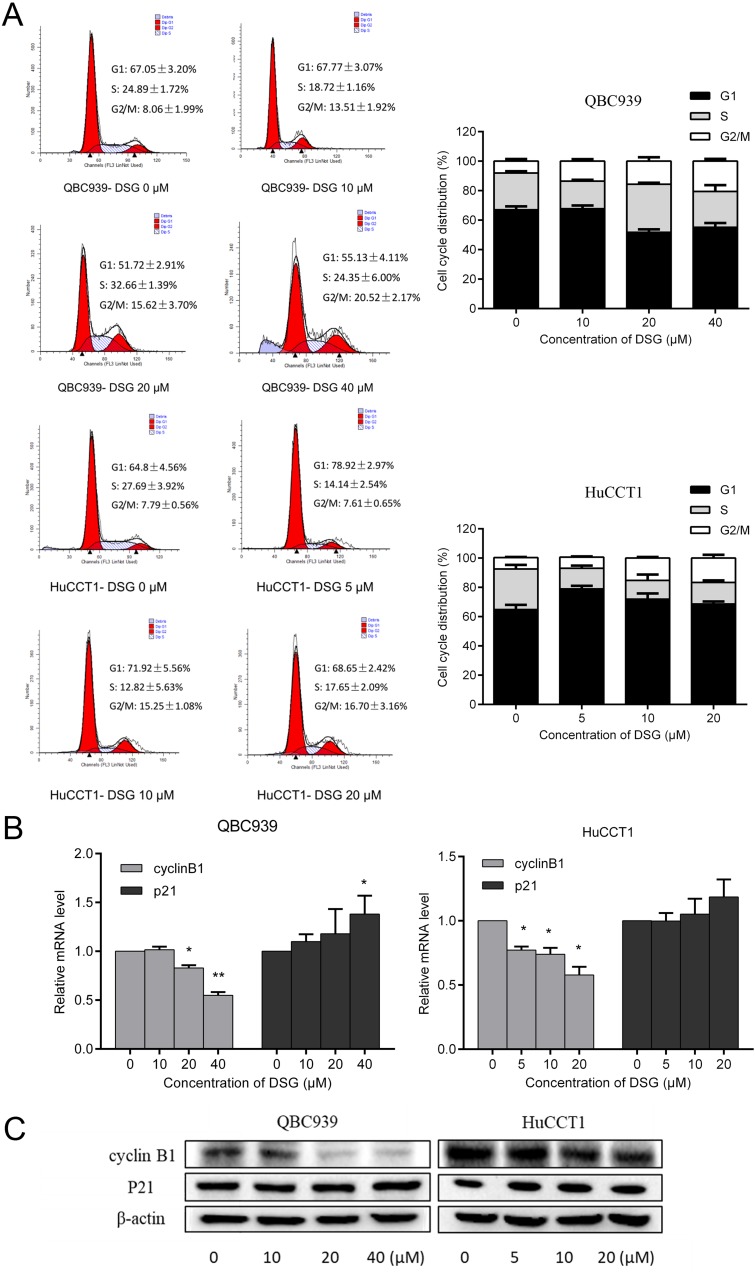
Figure 2.
The change of cell cycle distribution after treatment with DSG. (A) Cells were treated with DSG at various concentrations for 24 h, and examined by FCM. Representative results were shown (left). Histogram showed the quantified data (right). (B, C) The qPCR and Western blot analysis for the expression of cyclinB1 and P21. *P < 0.05 and **P < 0.01.

